A measurement of beauty hadron production at mid-rapidity in proton-lead collisions at a nucleon-nucleon centre-of-mass energy $\sqrt{s_{\rm NN}}=5.02$ TeV is presented. The semi-inclusive decay channel of beauty hadrons into J/$\psi$ is considered, where the J/$\psi$ mesons are reconstructed in the dielectron decay channel at mid-rapidity down to transverse momenta of 1.3 GeV/$c$. The ${\rm {b\overline{b}}}$ production cross section at mid-rapidity, ${\rm d}\sigma_{\rm {b\overline{b}}}/{\rm d} y$, and the total cross section extrapolated over full phase space, $\sigma_{\rm {b\overline{b}}}$, are obtained. This measurement is combined with results on inclusive J/$\psi$ production to determine the prompt J/$\psi$ cross sections. The results in p-Pb collisions are then scaled to expectations from pp collisions at the same centre-of-mass energy to derive the nuclear modification factor $R_{\rm pPb}$, and compared to models to study possible nuclear modifications of the production induced by cold nuclear matter effects. $R_{\rm pPb}$ is found to be smaller than unity at low $p_{\rm T}$ for both J/$\psi$ coming from beauty hadron decays and prompt J/$\psi$.
Eur. Phys. J. C 78 (2018) 466
HEP Data
e-Print: arXiv:1802.00765 | PDF | inSPIRE
CERN-EP-2018-010
Figure 1
Invariant mass (left panel) and pseudoproper decay length (right panel) distributions for \PJpsi candidates with $\Pt >1.3$ GeV/$c$ with superimposed projections of the maximum likelihood fit The latter distribution is limited to the \PJpsi candidates under the mass peak, i.e. for $2.92 < m_{\Pep\Pem} < 3.16 $ GeV/$c^2$, for display purposes only The $\chi^2$ values of these projections are also reported for both distributions | 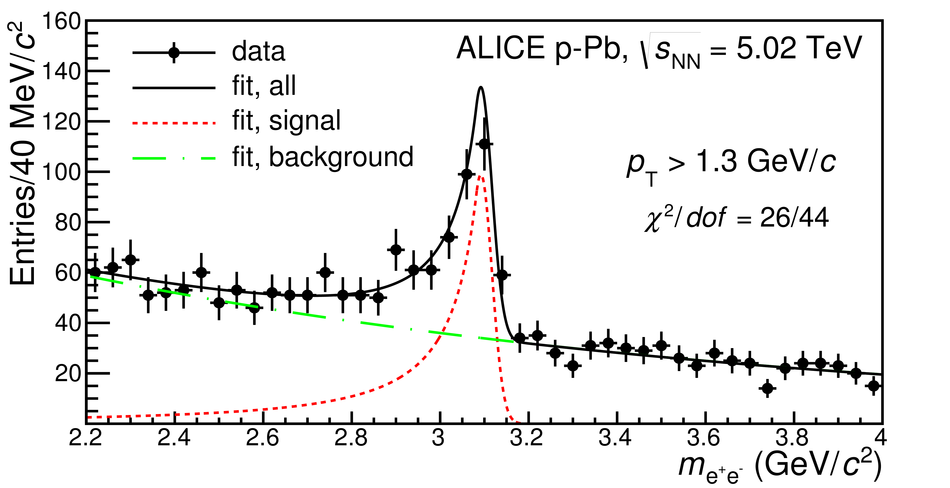 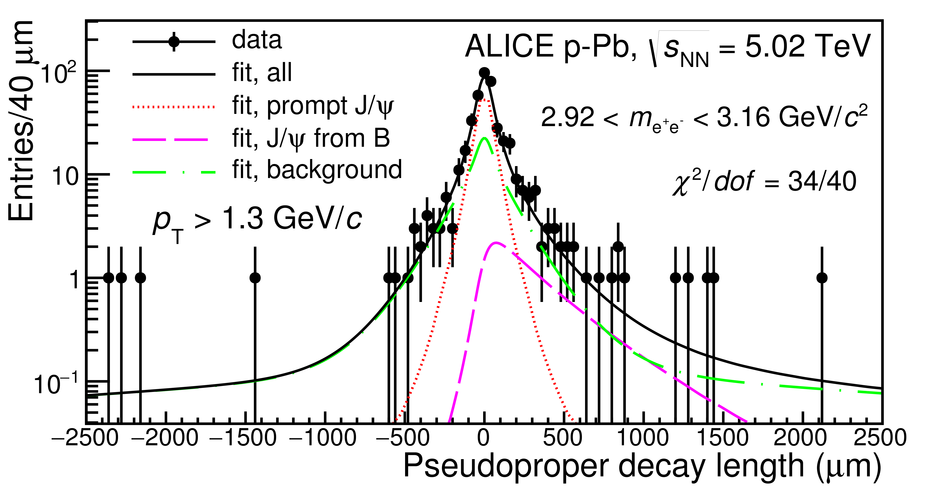 |
Figure 2
Invariant mass (left panels) and pseudoproper decay length (right panels) distributions in different \pt\ intervals with superimposed projections of the maximum likelihood fit The $x$ distributions are limited to the \PJpsi candidates under the mass peak The $\chi^2$ values of these projections are also reported for all distributions | 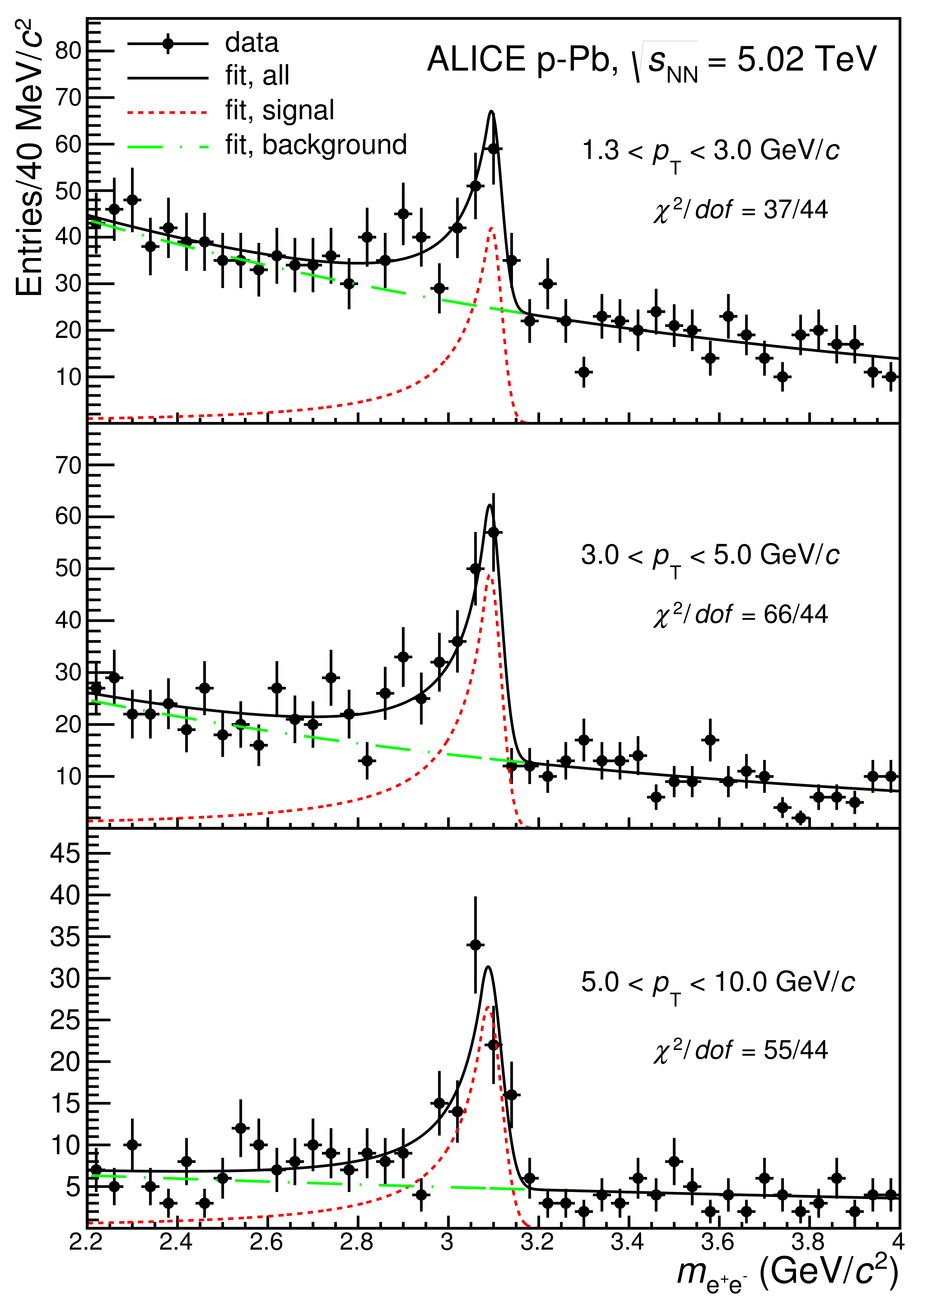 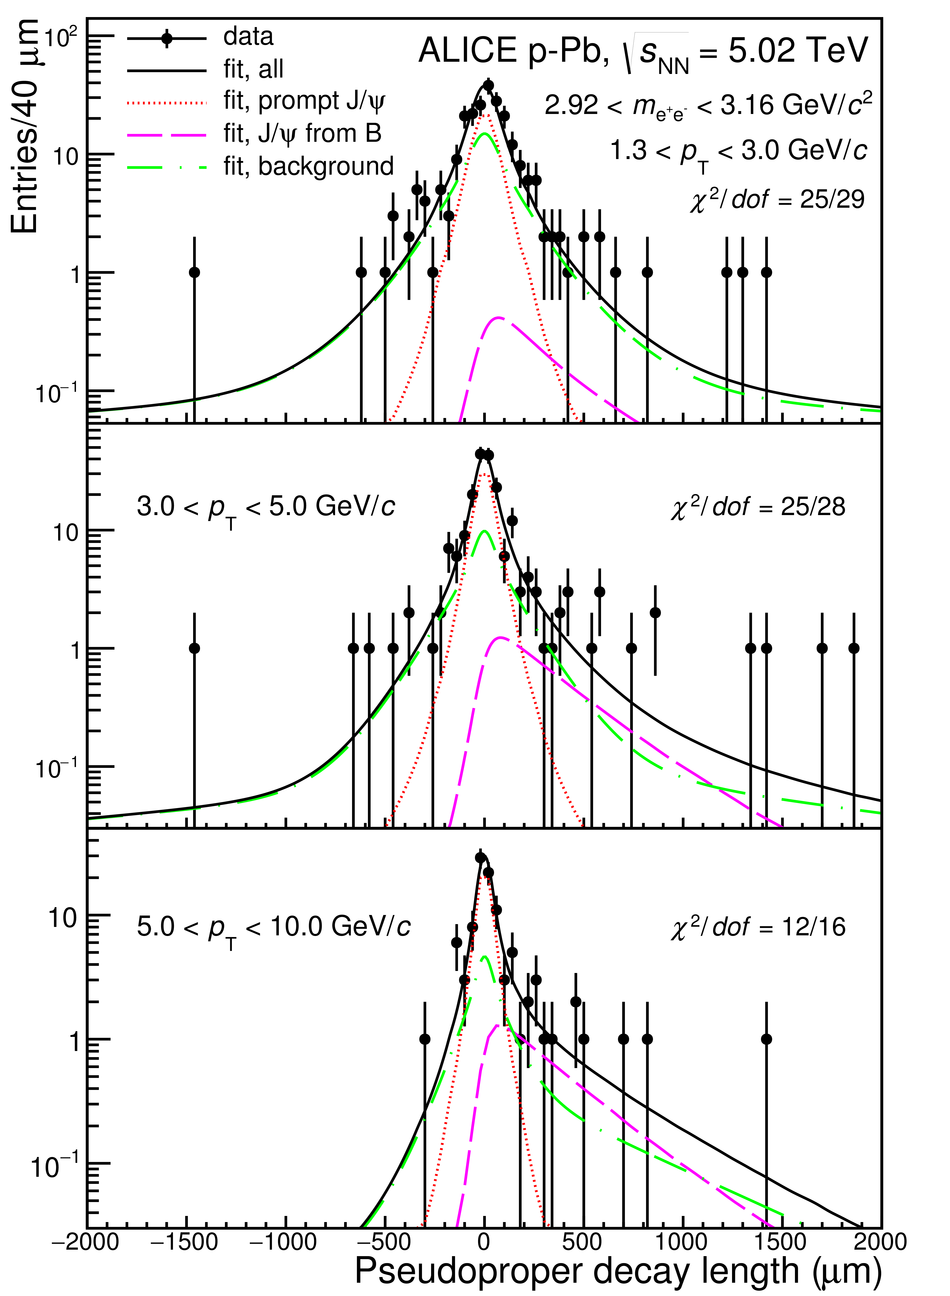 |
Figure 3
Fraction of \PJpsi from the decay of b-hadrons at mid-rapidity as a function of the \pt\ of \PJpsi in p-Pb collisions at $\sqrt{s_{\rm NN}}=5.02$ TeV compared with results from ATLAS in the same colliding system and results of ALICE , ATLAS and CMS in pp collisions at either $\sqrt{s}=7$ TeV or $\sqrt{s}=8$ TeV Results from CDF in ${\rm p \overline{p}}$ collisions at $\sqrt{s}=1.96$ TeV are also shown The ALICE data symbols are placed horizontally at the average value of the \pt\ distribution of each interval (see text for details) For all experiments, the vertical error bars represent the quadratic sum of the statistical and systematic errors In the interval $1.3 < \Pt < 3 $ GeV/$c$ the upper limit at the 95\% confidence level is shown, as discussed in the text | 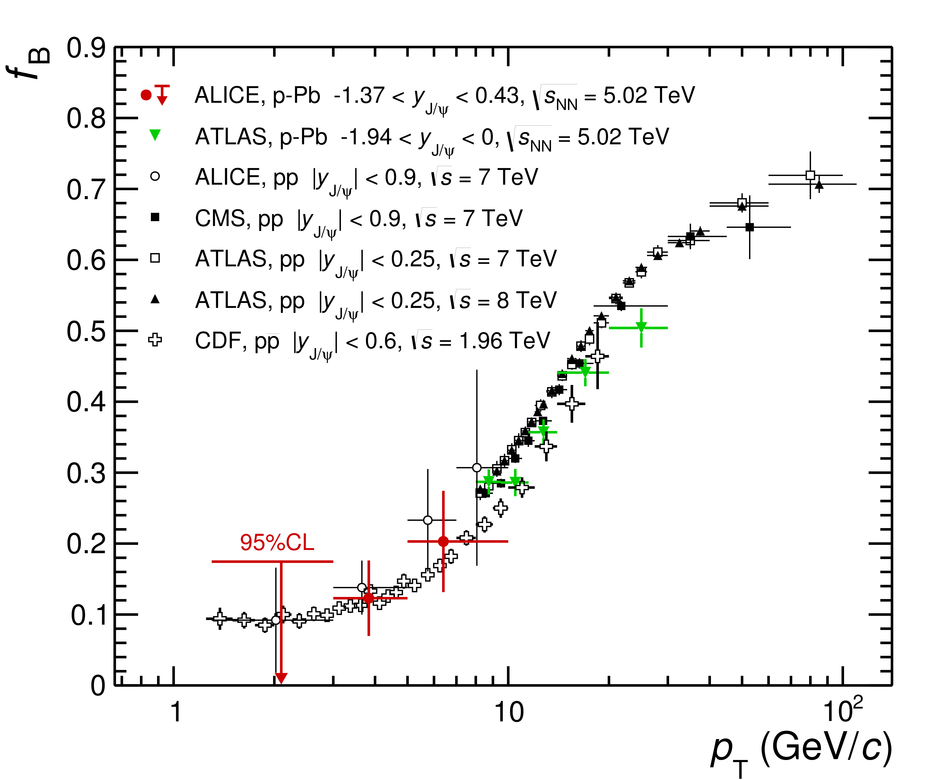 |
Figure 4
$\dd \sigma_{\rm \PJpsi \, from \, B} / \dd y$\as a function of $y$ (left panel) compared to results obtained in the forward and backward rapidity regions by LHCb and $\dd^2 \sigma_{\rm \PJpsi \, from \, B} / \dd y \, \dd\Pt$\as a function of \pt\ (right panel) compared to ATLAS results The error bars represent the statistical uncertainties,while the systematic uncertainties are shown as boxes In the right panel, the upper limit at the 95\% confidence level is shown with an arrow for the interval $1.3 < \Pt < 3 $ GeV/$c$ The systematic uncertainty on the extrapolation to \pt = 0 (left panel only) is indicated by thefilled red box Results from FONLL computations with EPPS16 nuclear modificationof the CTEQ6.6 PDFs are shown superimposed, including thetotal theoretical uncertainty (empty band/boxes) and the EPPS16 contribution (coloured band/boxes) | 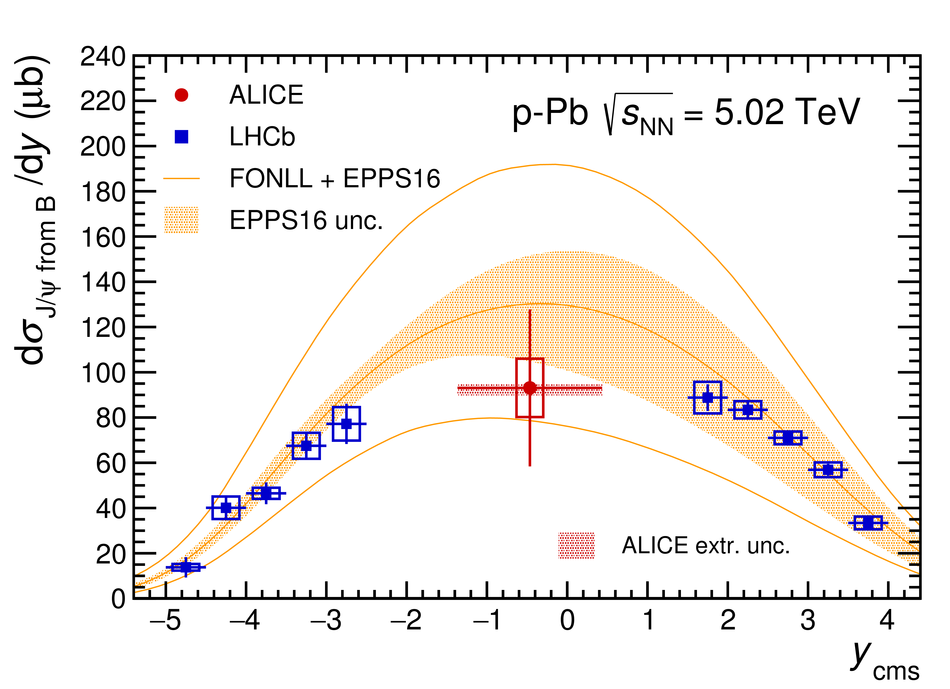 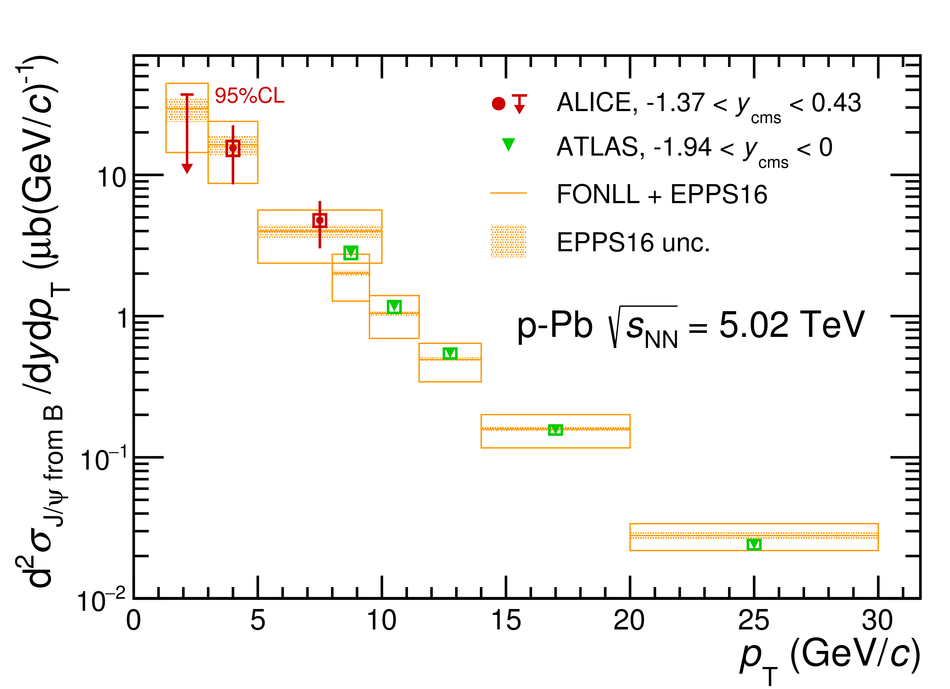 |
Figure 5
The nuclear modification factor $R_{\rm pPb}$ of non-prompt \PJpsi as a function of rapidity for $\Pt>0$ (left panel) and as a function of \pt\ at mid-rapidity (right panel). The error bars and the open boxes indicate, respectively, the statistical and systematic uncertainties In the left hand panel, the results from the LHCb experiment are taken from and the systematic uncertainty on the extrapolation to $\Pt = 0$ for the ALICE data point is depicted by the filled red box In the right hand plot, the results from the CMS experiment are taken from and the arrow shows the upper limit at 95\% confidence level for the interval $1.3 < \Pt< 3$ GeV/$c$ The nuclear modification factors as expected from the EPPS16 and the nDSg (central value shown in the left panel only) parameterisations are shown superimposed | 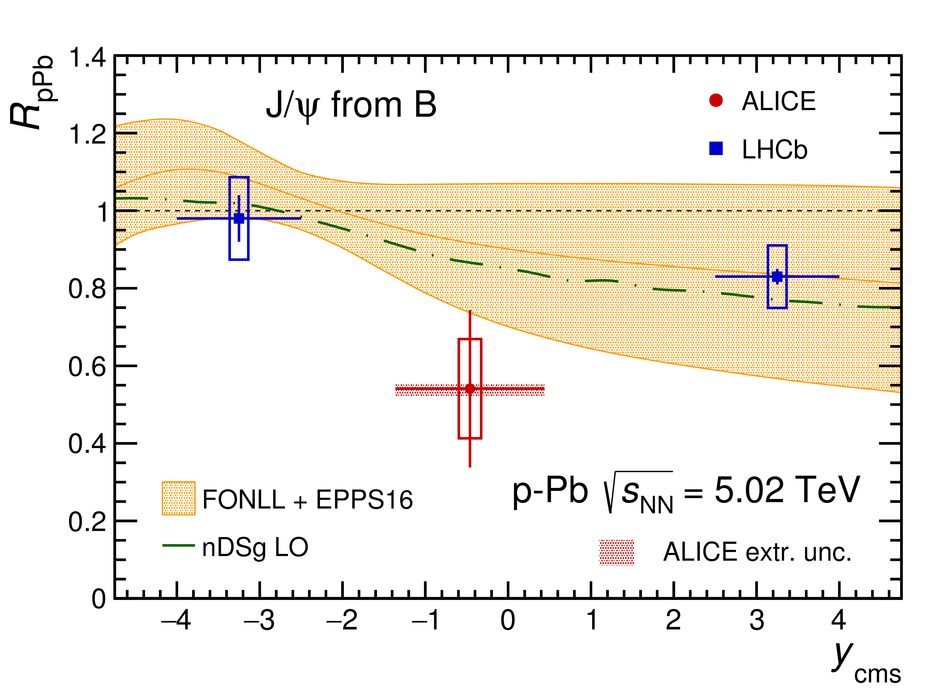 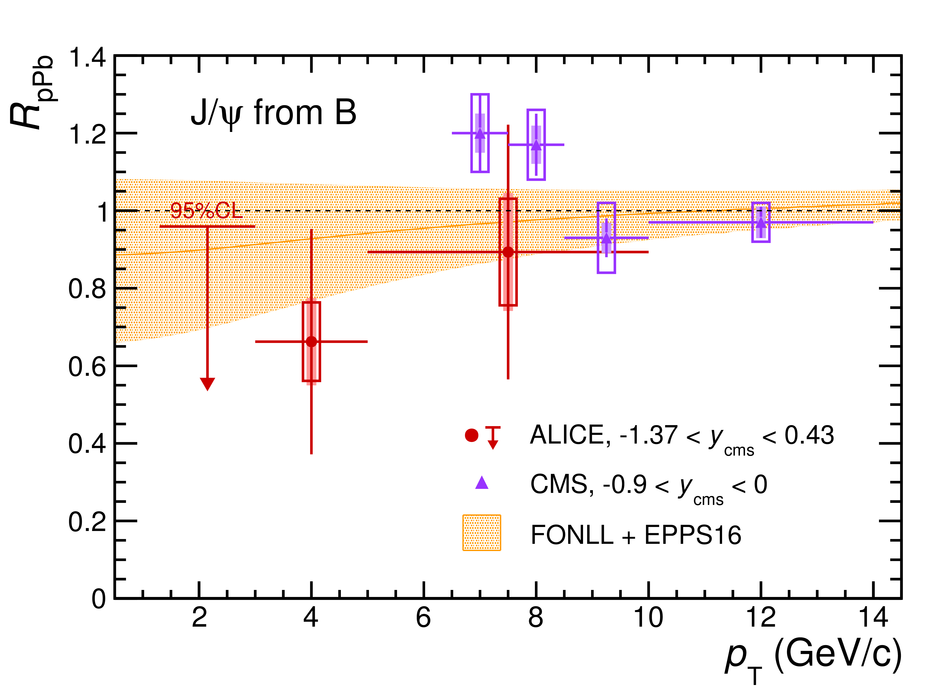 |
Figure 6
Beauty production cross section in p-A collisions as a function of $\sqrt{s_{\rm NN}}$ as measured by ALICE and at fixed-target experiments (E789 , E771 and HERA-B ) The FONLL calculations with EPPS16 nuclear modification to the PDFs are superimposed in orange The full lines show the total theoretical uncertainty, while the coloured band corresponds to the contribution from the EPPS16 uncertainties | 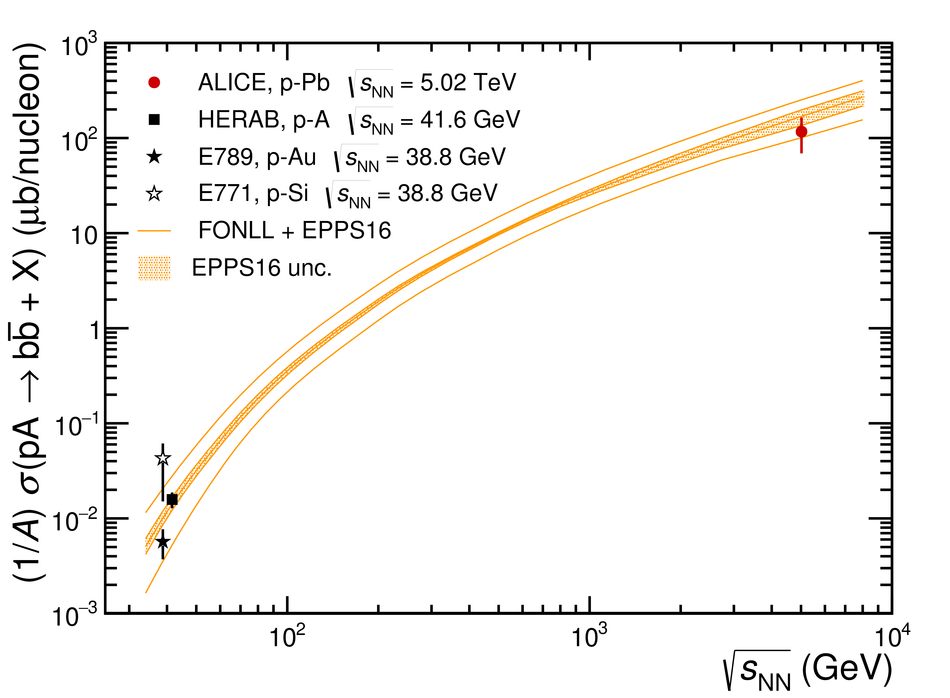 |
Figure 7
$R_{\rm pPb}$ of prompt \PJpsi versus rapidity (left panel) and as a function of \pt\ at mid-rapidity (right panel), compared to theoretical calculations Statistical uncertainties are represented by vertical error bars, while open boxes correspond to systematic uncertainties Results from the LHCb experiment at backward and forward rapidity are shown in the left panel The box around $R_{\rm pPb} = 1$ in the right panel shows the size of the correlated relative uncertainty Results from various models are also shown, see text for details | 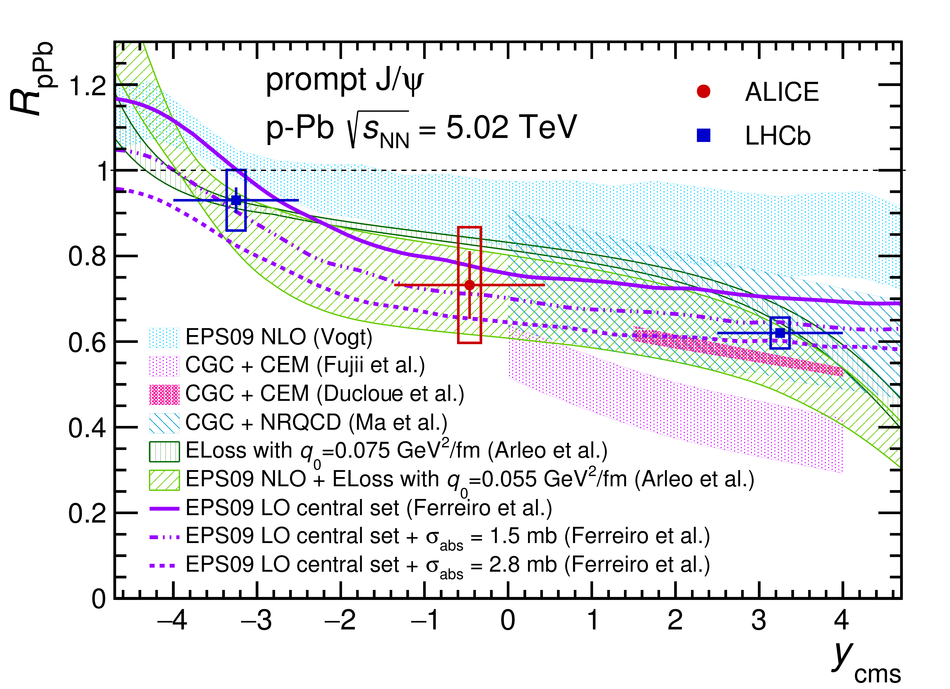 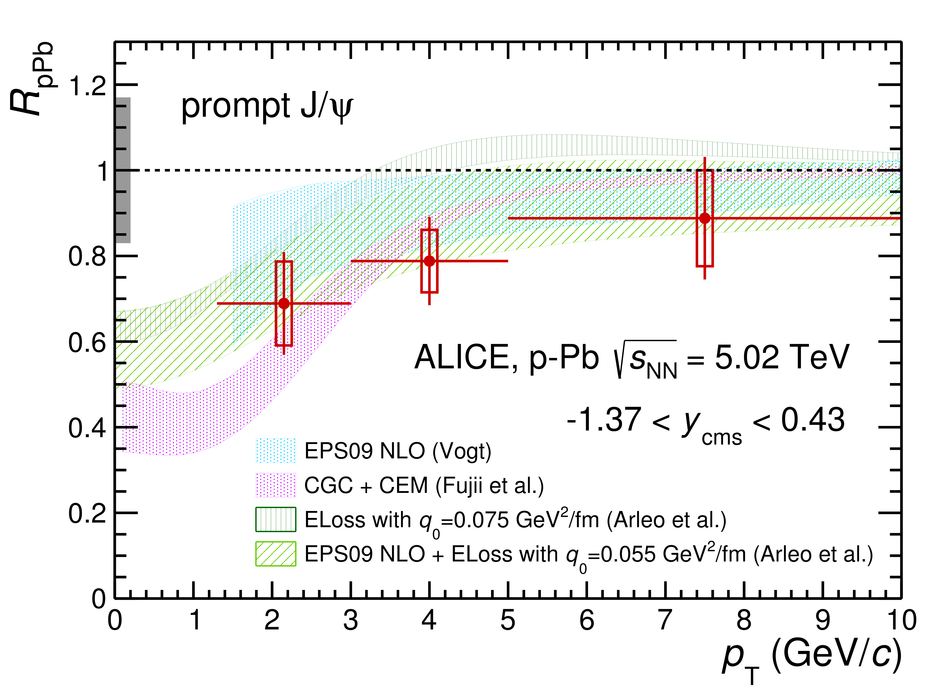 |