Top: Inclusive differential $\omega$ production cross section${\rm d}^2\sigma_\omega/{\rm d}y {\rm d}\pt$ for $2.5 < y < 4$ The error bars represent the quadratic sum of the statistical and systematicuncertainties, the red boxes thepoint-to-point uncorrelated systematic uncertainty, the blue box onthe left the error on normalization. Data are fitted with Eq. (1)(solid line) and compared with the Perugia-0, Perugia-11,ATLAS-CSC and D6T PYTHIA tunes and PHOJET Bottom: Ratio between data and models. \begin{align*} &(1)& dN \over dp_{\rm t} &= C&p_{\rm t} \over [1 +(p_{\rm t}/p_{\rm 0})^2]^n \end{align*} | 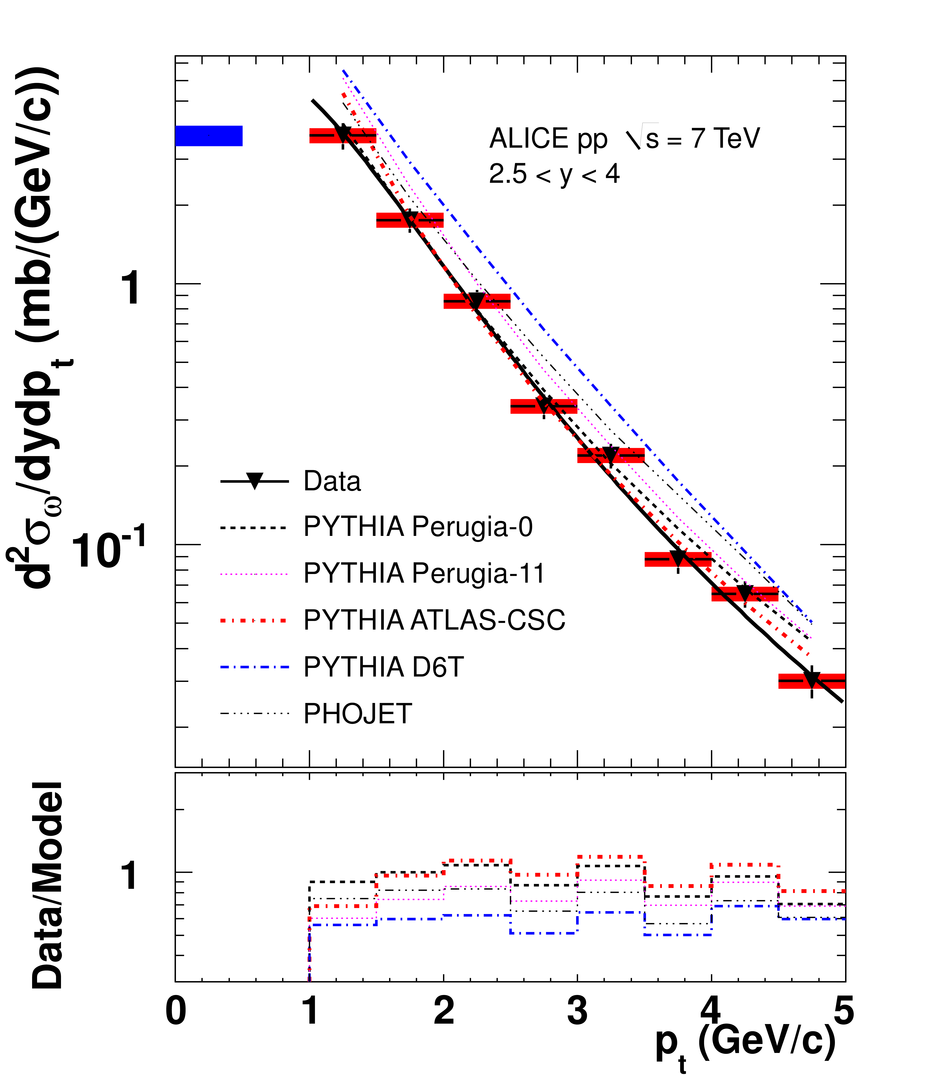 |