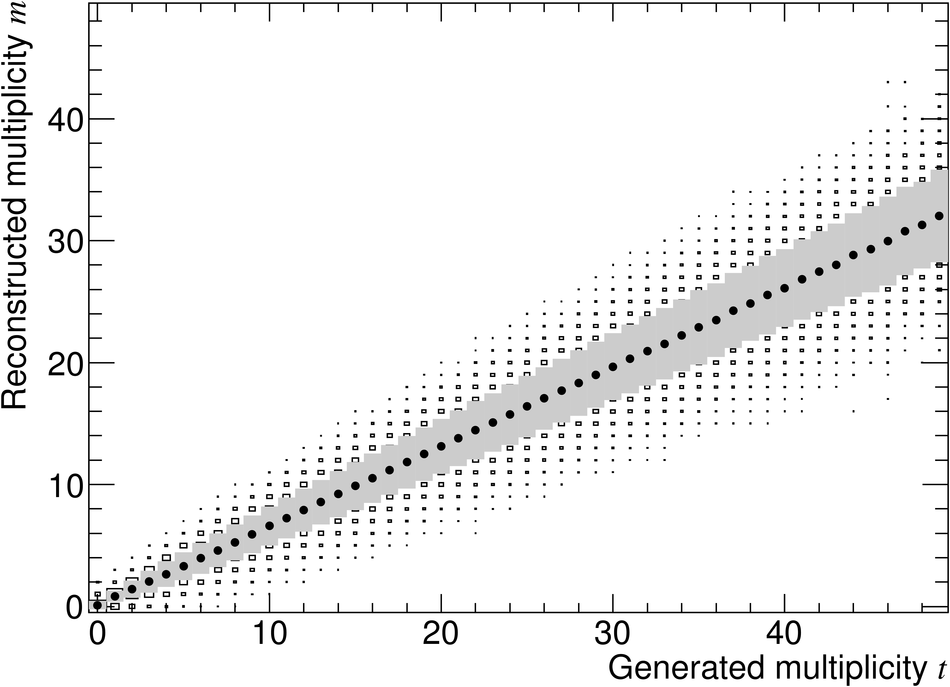
Graphical representation of the detector response matrix: number of tracklets found in the SPD ($m$) vs the number of generated primary particles in $|\eta| < 1.0$ ($t$) for $\sqrt{s} = 0.9 $TeV The distribution of the measured tracklet multiplicity for a given generated multiplicity shown with its most probable value (dots), r.m.s. (shaded areas), and full spread (squares). |  |