Production of pions, kaons and protons in pp collisions at $\sqrt{s}=900$ GeV with ALICE at the LHC

The production of $\pi^+$, $\pi^-$, $K^+$, $K^-$, p, and $\rm\overline{p}$ at mid-rapidity has been measured in proton-proton collisions at $\sqrt{s} = 900$ GeV with the ALICE detector. Particle identification is performed using the specific energy loss in the inner tracking silicon detector and the time projection chamber. In addition, time-of-flight information is used to identify hadrons at higher momenta. Finally, the distinctive kink topology of the weak decay of charged kaons is used for an alternative measurement of the kaon transverse momentum ($p_{\rm T}$) spectra. Since these various particle identification tools give the best separation capabilities over different momentum ranges, the results are combined to extract spectra from $p_{\rm T}$ = 100 MeV/$c$ to 2.5 GeV/$c$. The measured spectra are further compared with QCD-inspired models which yield a poor description. The total yields and the mean $p_{\rm T}$ are compared with previous measurements, and the trends as a function of collision energy are discussed.


Eur. Phys. J. C 71 (2011) 1655
HEP Data
e-Print: arXiv:1101.4110 | PDF | inSPIRE
CERN-PH-EP-2010-085

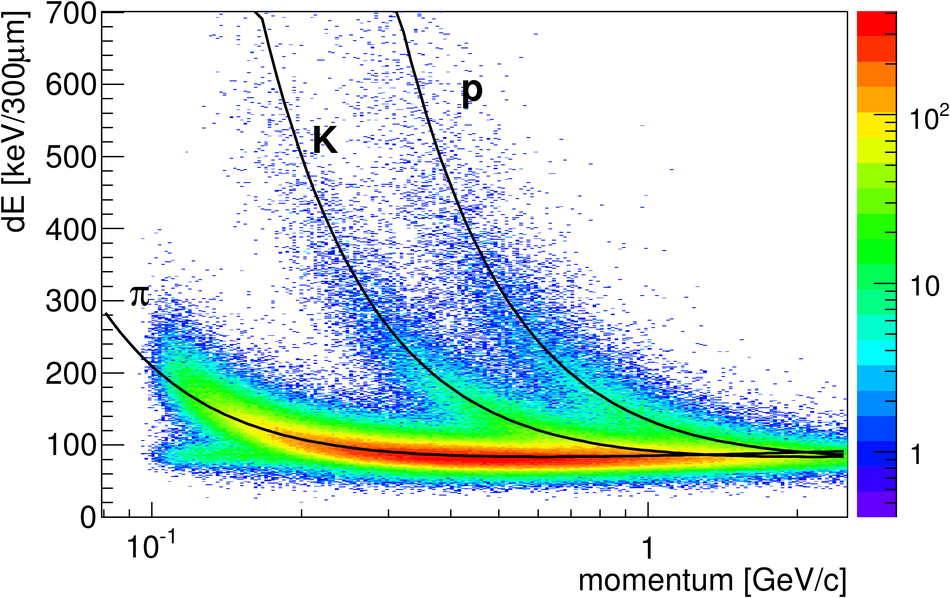
Figure 1

Specific energy loss d$E$/d$x$$ $vs.$ $momentum for tracks measured with the ITS. The solid lines are a parametrization (from [23] ) of the detector response based on the Bethe-Bloch formula.

Figure 2

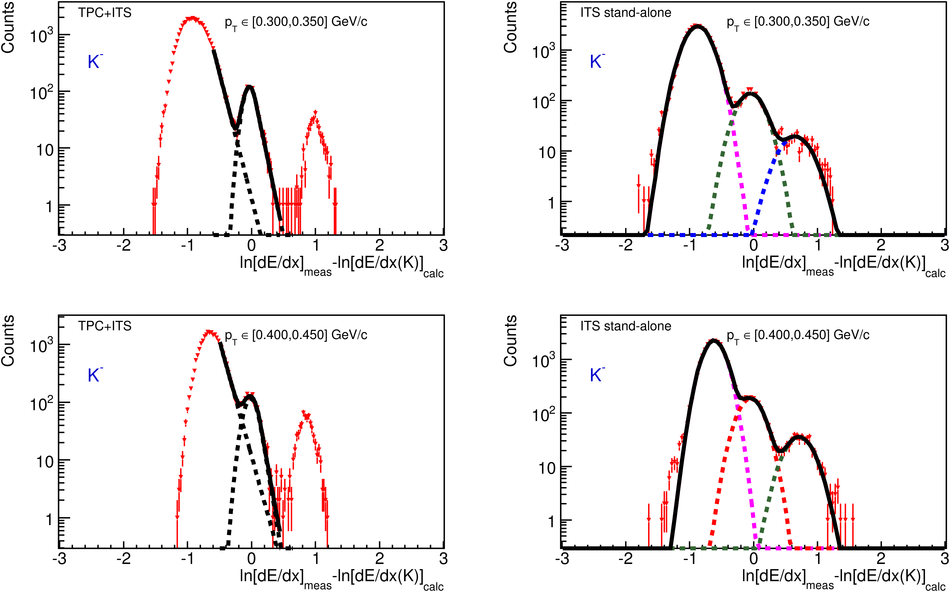
Distribution of ln[d$E$/d$x$]$_{\rm meas}-$ln[d$E$/d$x$(K)]$_{\rm calc}$ measured with the ITS in the two $\pt$-ranges, 300-350 MeV/$c$ (upper panels) and 400-450 MeV/$c$ (lower panels), using the kaon mass hypothesis. The left panels show the result for ITS-TPC combined tracks, while the right panels show the ITS stand-alone result. The lines indicate fits as described in the text.

Figure 3

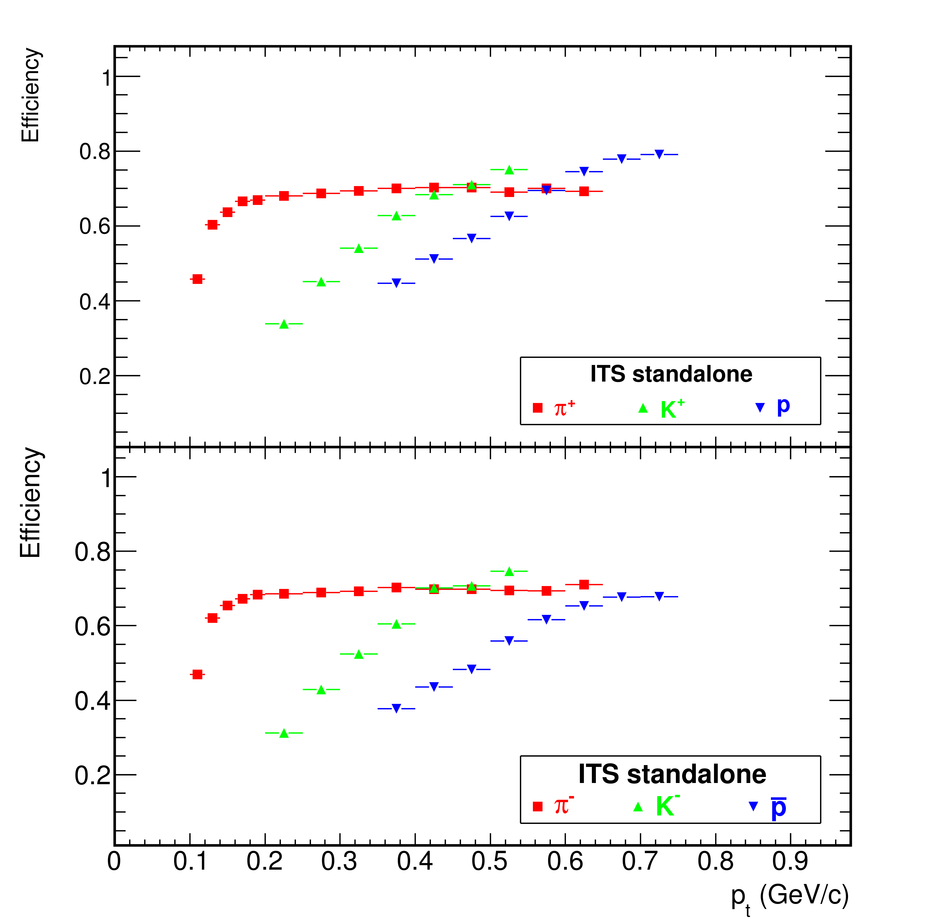
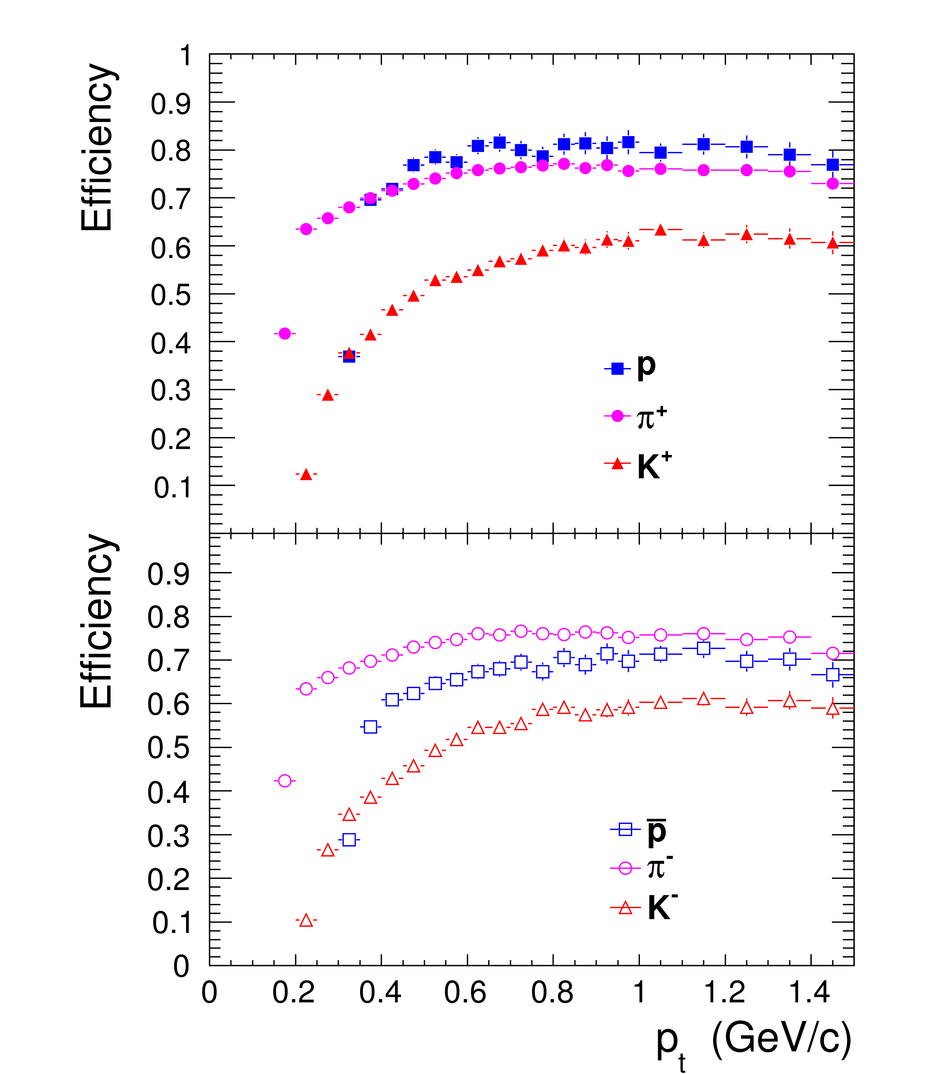
Efficiency for pions, kaons and protons for the ITS stand-alone analysis as obtained from Monte-Carlo simulations.

Figure 4

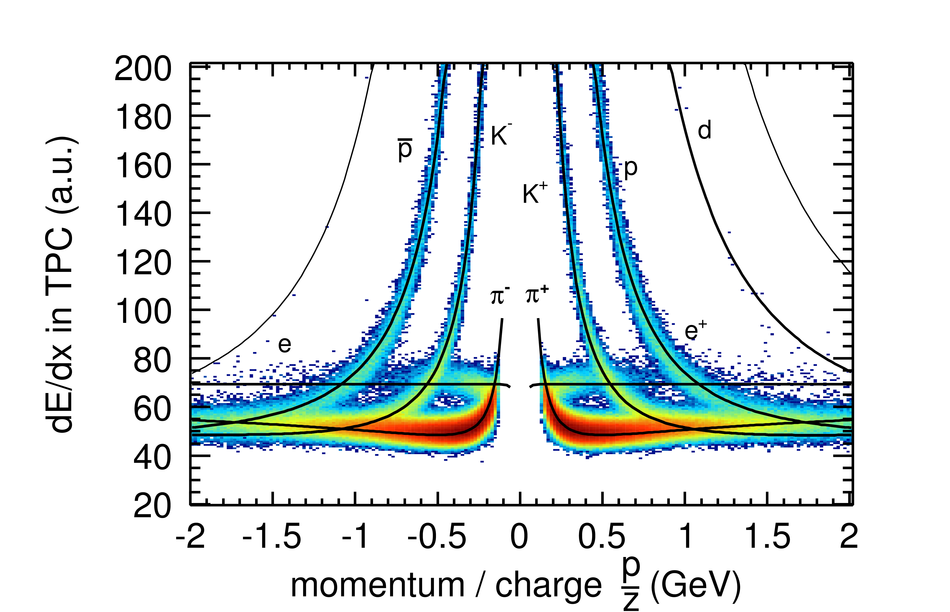
Specific energy loss d$E$/d$x$$ $vs.$ $momentum for tracks measured with the ALICE TPC. The solid lines are a parametrization of the Bethe-Bloch curve [25].

Figure 5

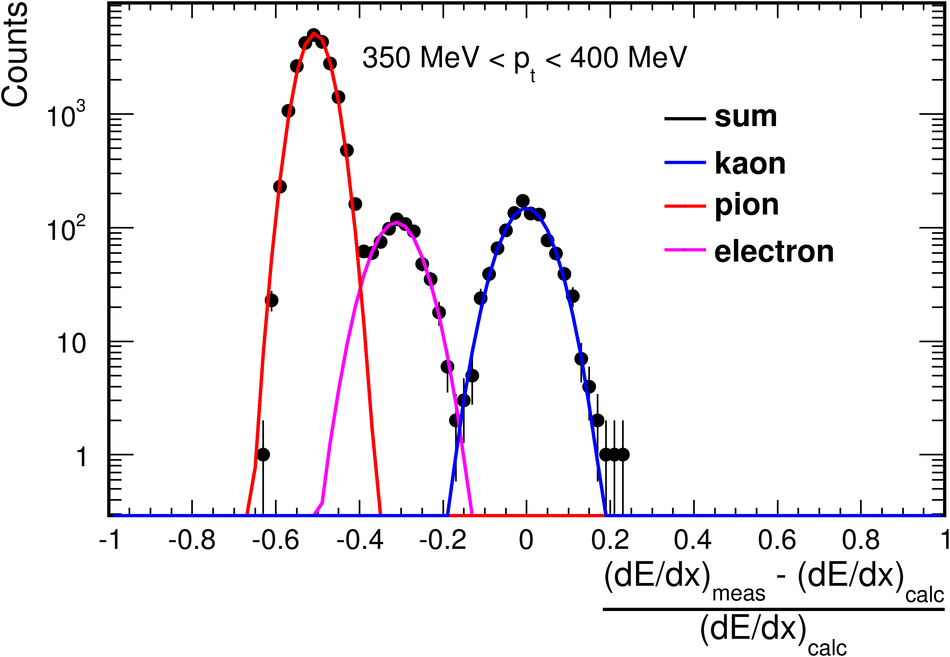
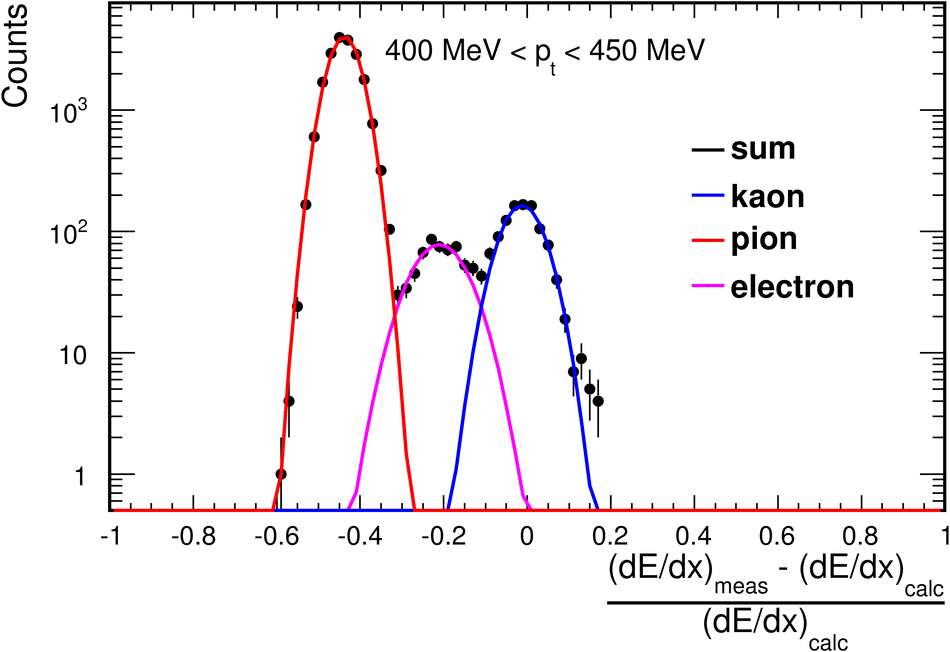
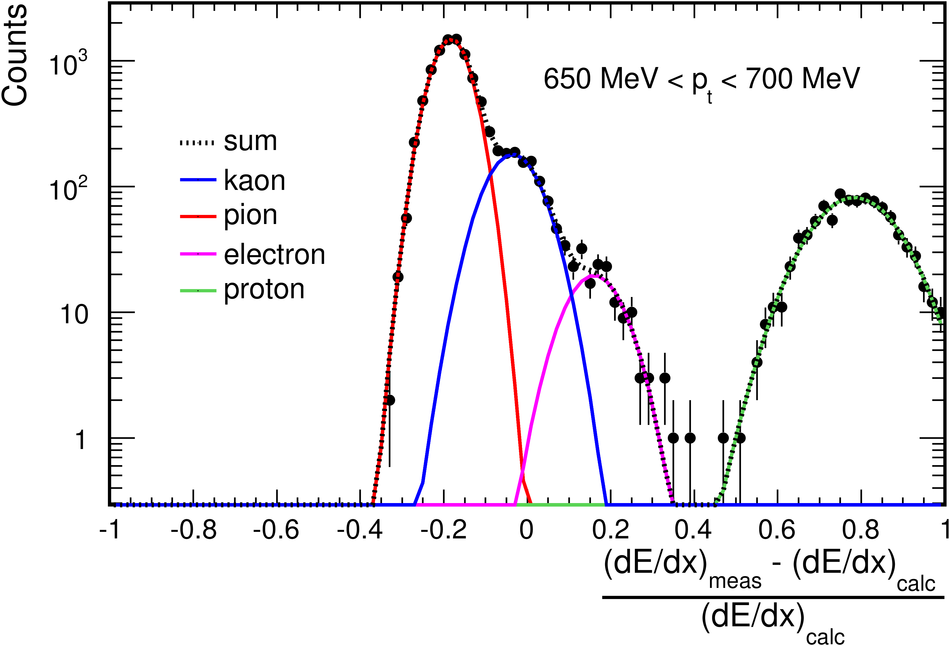
Distribution of ([d$E$/d$x$]$_{\rm meas}-$[d$E$ / d$x$(kaon)]$_{\rm calc}$)/[d$E$/d$x$(kaon)]$_{\rm calc}$measured with the TPC for several $\pt$-bins showing the separation power. The solid lines are Gaussian fits to the distributions.

Figure 6

Efficiency of charged pions, kaons, andprotons for the spectra extracted with the TPC.

Figure 8

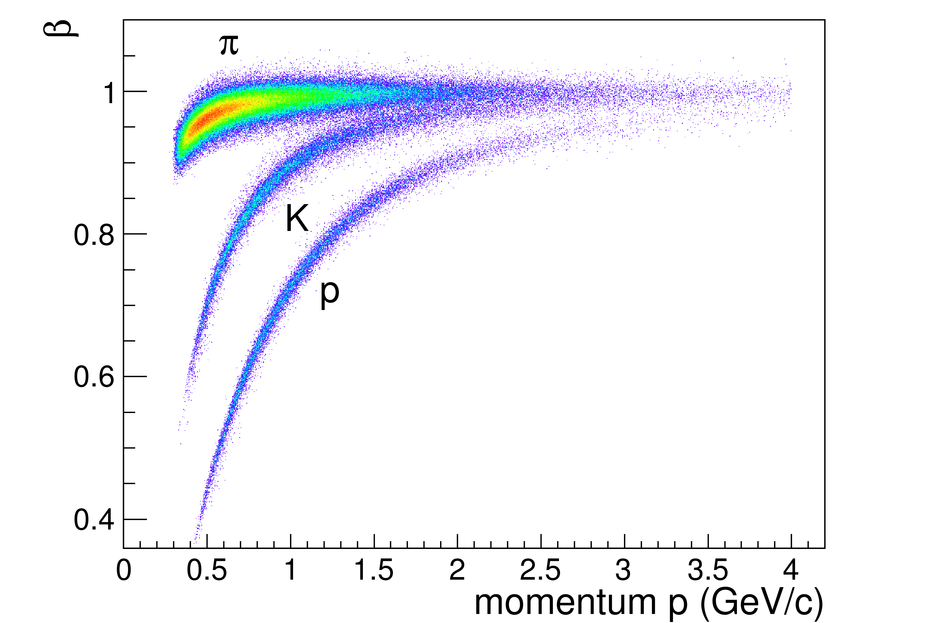
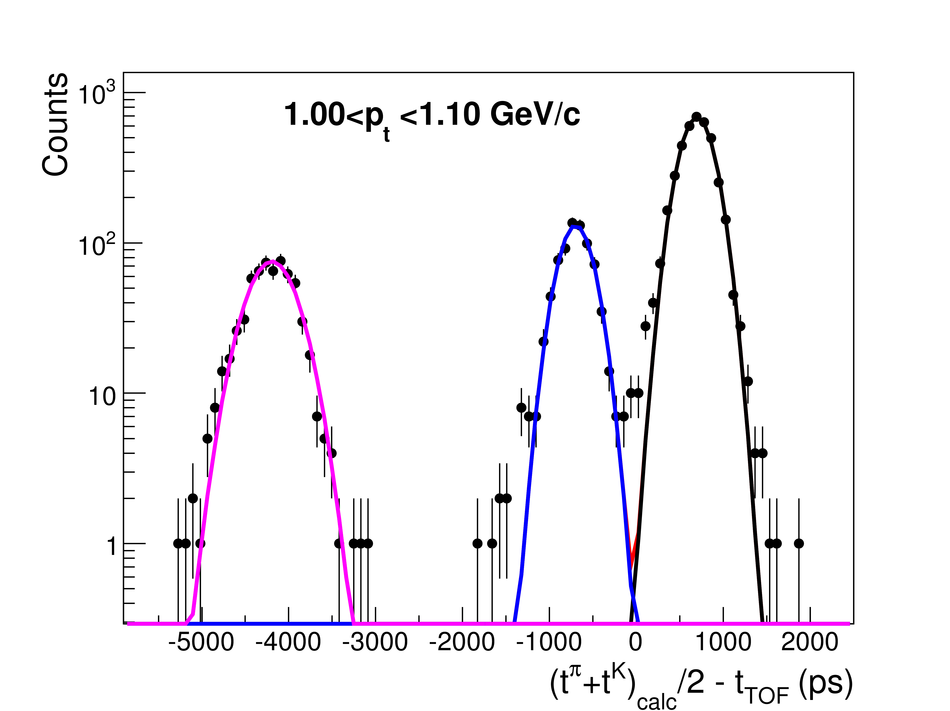
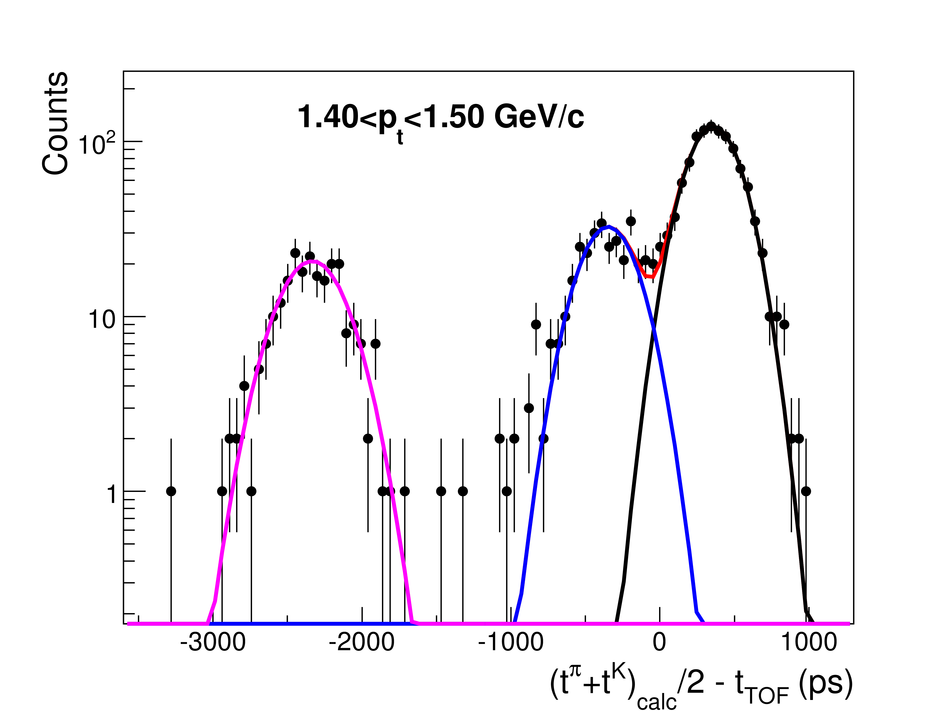
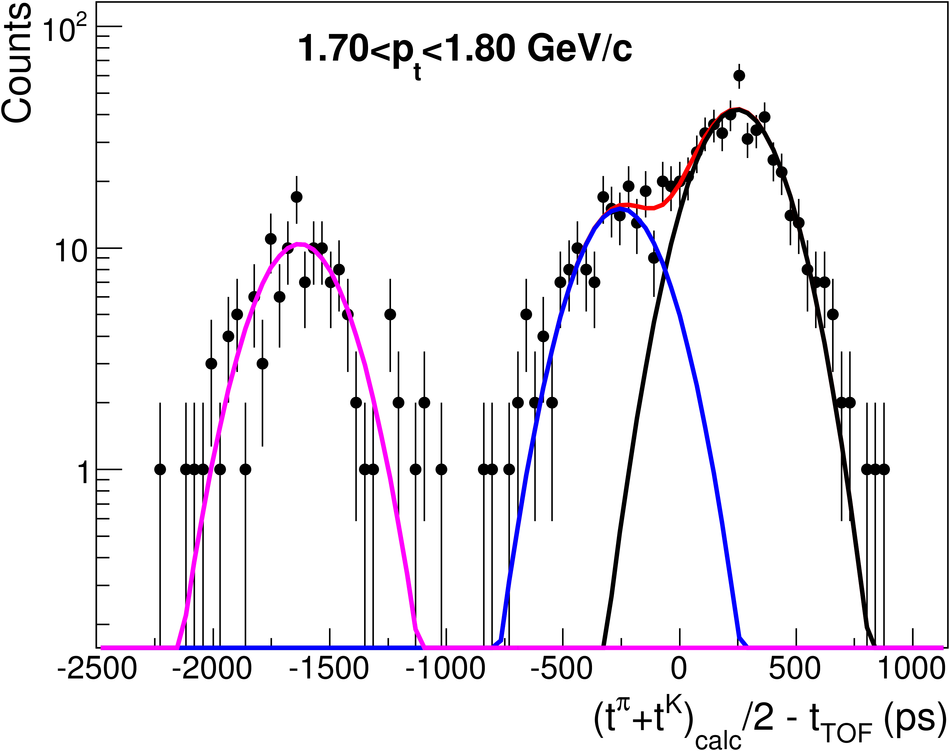
Distribution of the time difference between the measured TOF signal and the average of the calculated times for pions and kaons for several $\pt$-bins for positively charged particles. The fits are performed using Gaussian shapes.

Figure 9

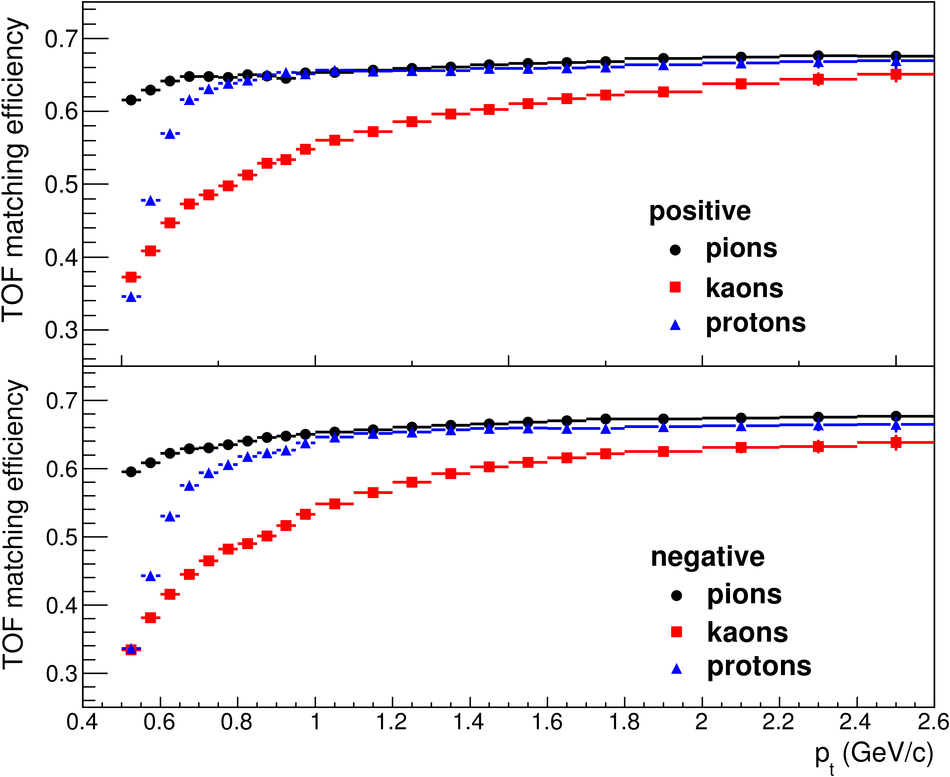
The TOF matching efficiency is shown for the three particles, separately, for (top) positive and (bottom) negative particles.

Figure 10

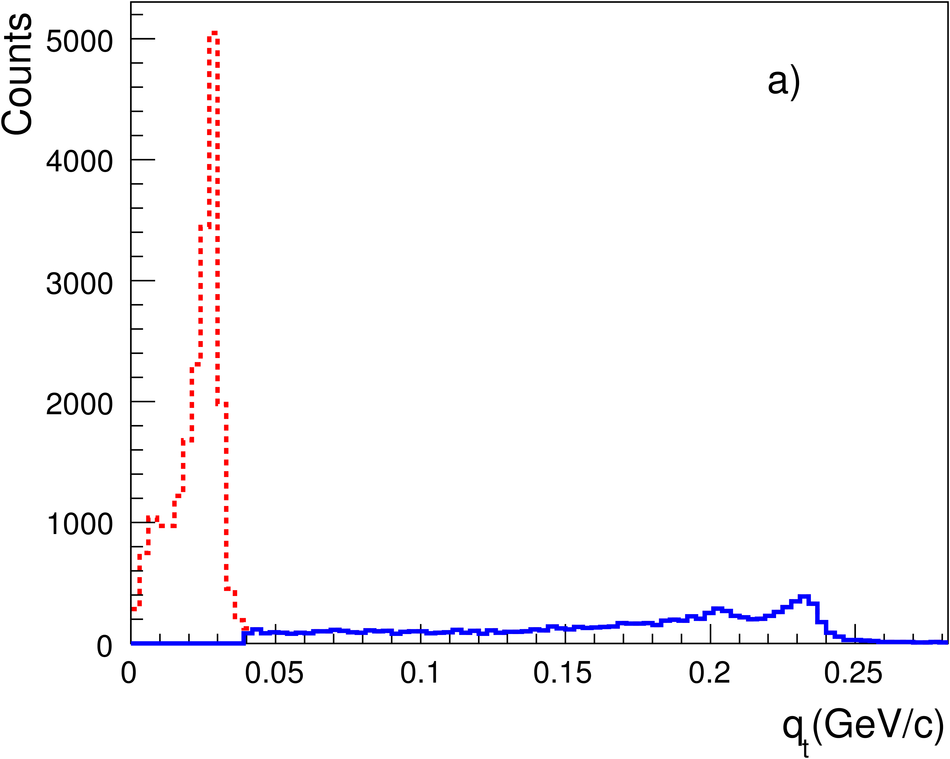
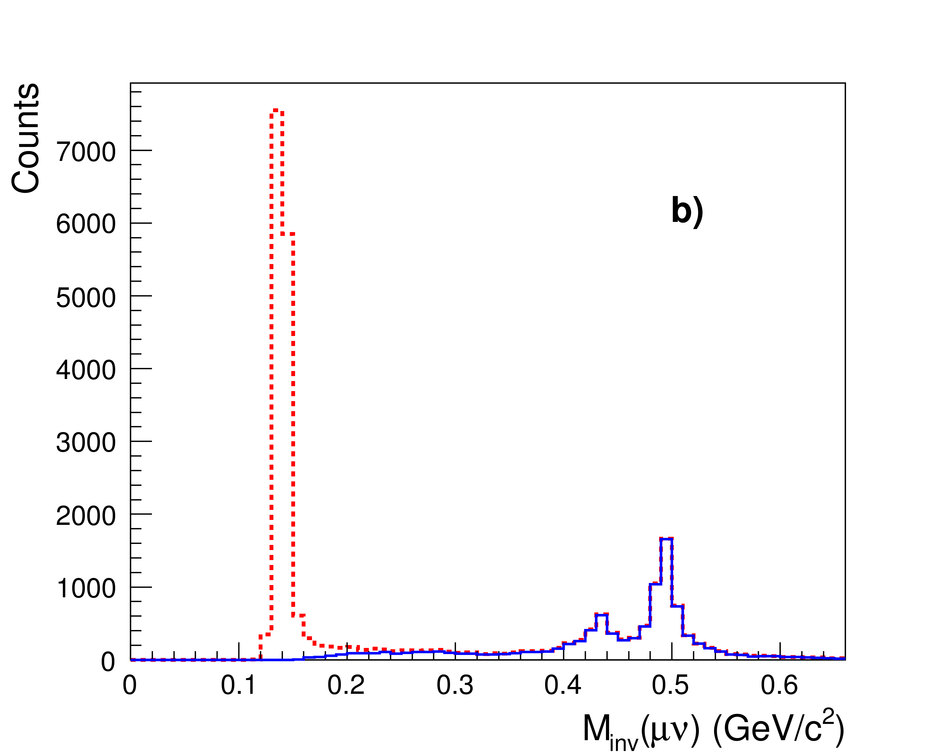
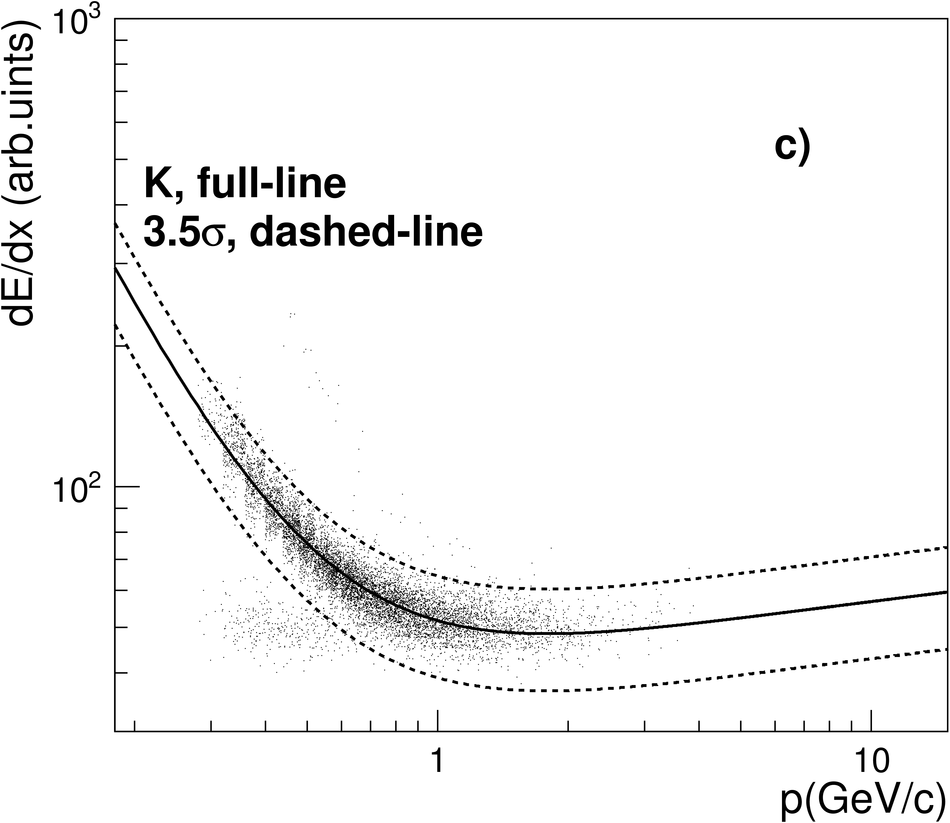
(a) $q_{\rm t}$ distribution of the daughter tracks with respect to mother momentum for all reconstructed kinks inside the analyzed sample. The dashed(solid)histograms show the distribution before (after) applying the $q_{\rm t}> 40$ MeV/$c$ cut (b) Invariant mass of the two-body decays $\rm{K^\pm}/{\pi^\pm}\rightarrow\mu^\pm +\nu_{\mu}$ for candidate kaon kinks. Solid curve: after applying $q_{\rm t}>$40 MeV/$c$; dashed curve: without this selection (hence also showing the pion decays) (c) d$E$/d$x$ of kinks as a function of the mother momentum, after applying the full list of selection criteria for their identification.

Figure 11

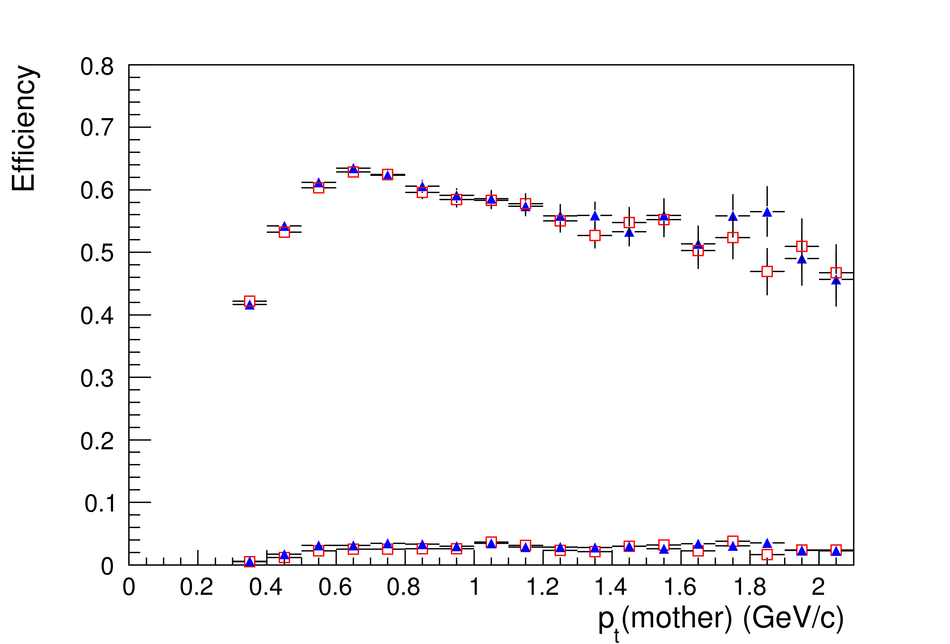
Upper panel: The acceptance of kaons decaying in the fiducial volume of the TPC as a function of thekaon $\pt$ for $\rm{K}^+$ (full-triangles) and $\rm{K}^-$(open-squares). Lower panel: The efficiency of reconstructed kaons from kinks as a function of the $\pt$ (mother), separately for $\rm{K}^+$ (full-triangles) and $\rm{K}^-$ (open-squares). The contamination from wrongly associated kinks is also plotted for both charges (lower set of points).

Figure 12

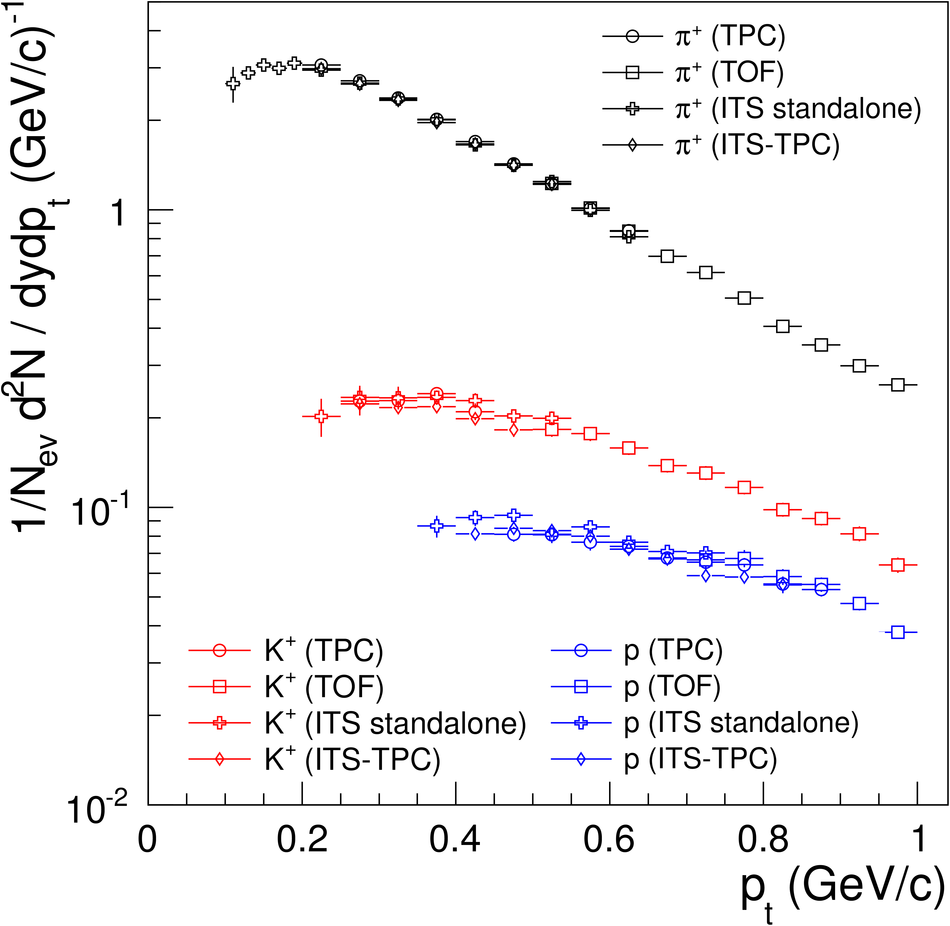
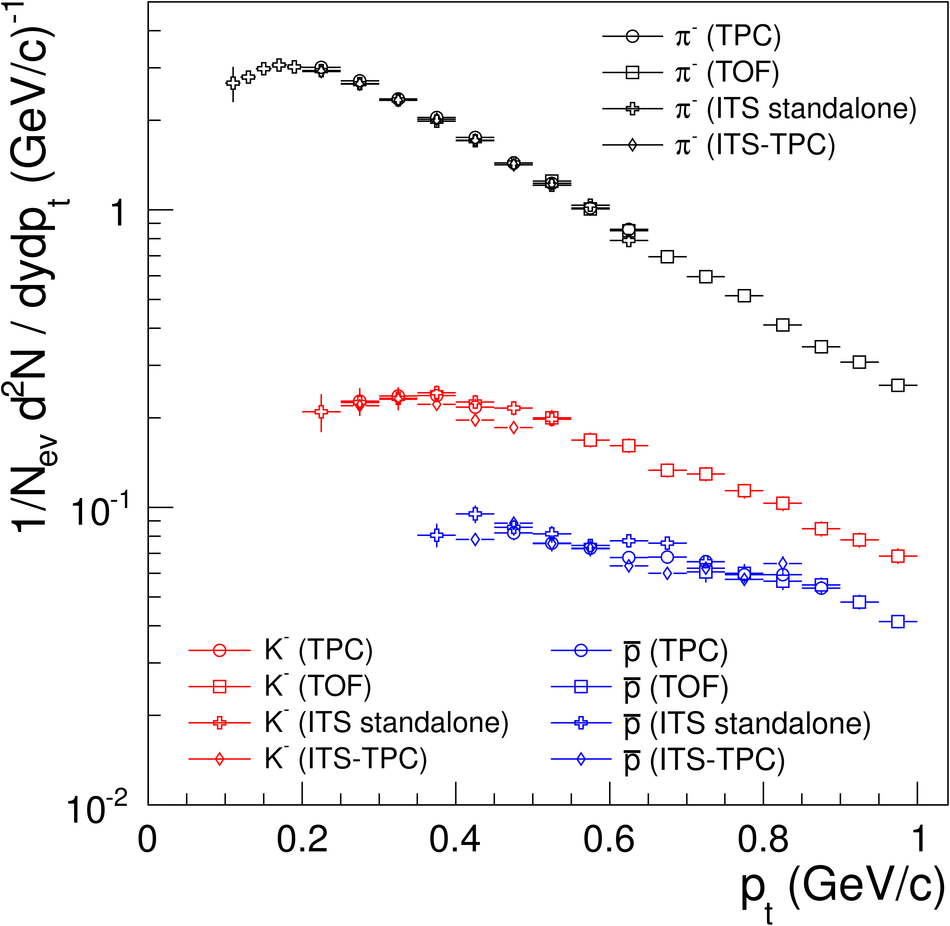
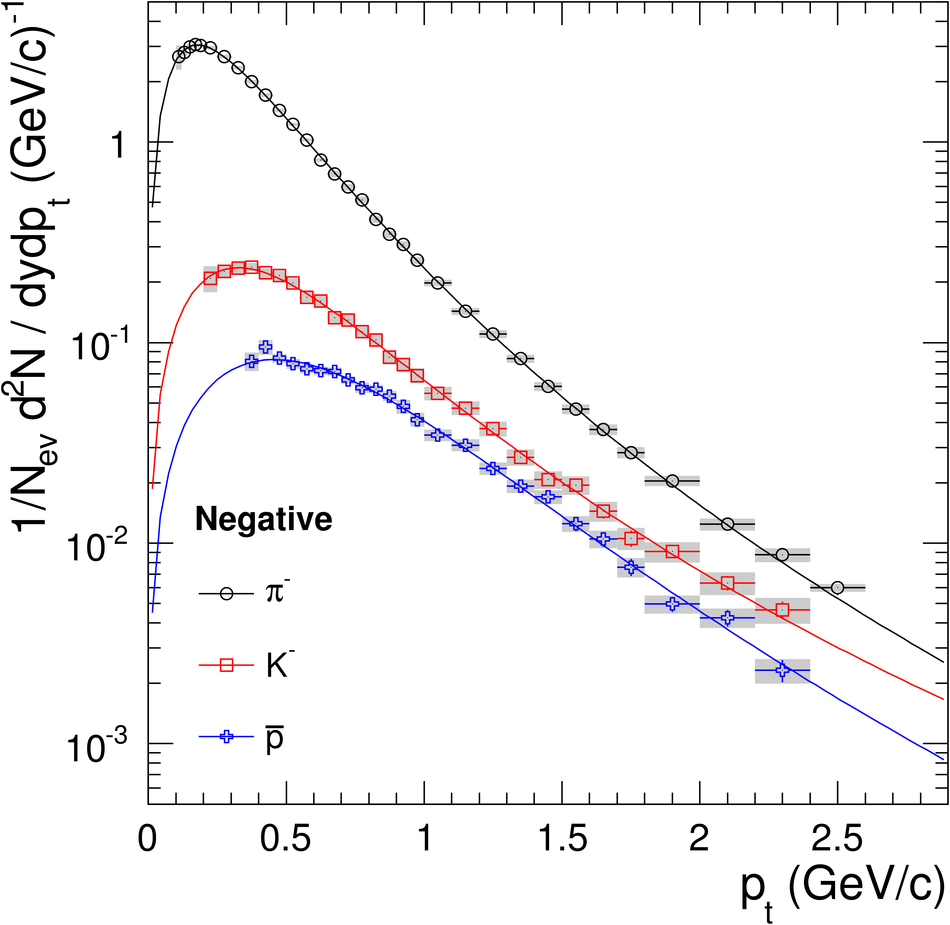
Transverse momentum spectra ${\rm d}^2N / ({\rm d}p_{\rm t}{\rm d}y)$ for $|y|< $ 0.5 of positive (upper part) and negative (lower part) hadrons from the various analyses. Only systematic errors are plotted.

Figure 13

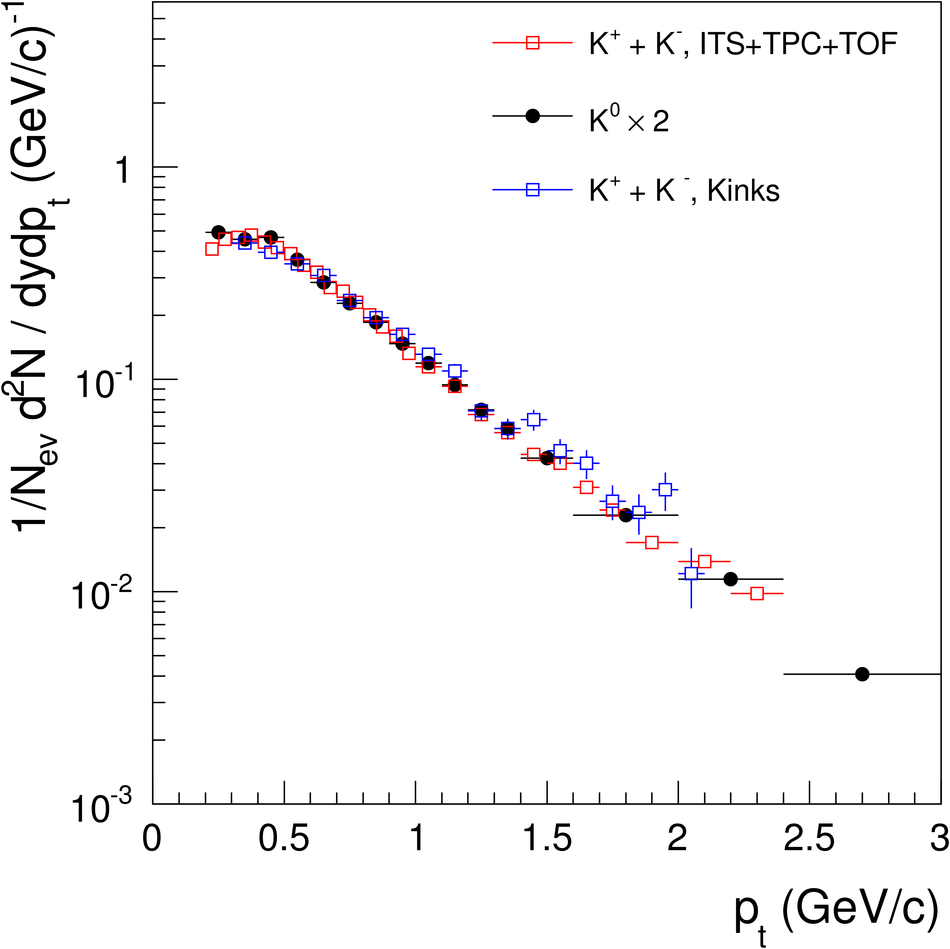
Comparison of charged kaon spectra, obtained from the combined ITS stand-alone, TPC, TOF analysis,from the kink topology and K$^0_s$ spectra from Ref [24]. Only statistical errors are shown.

Figure 14

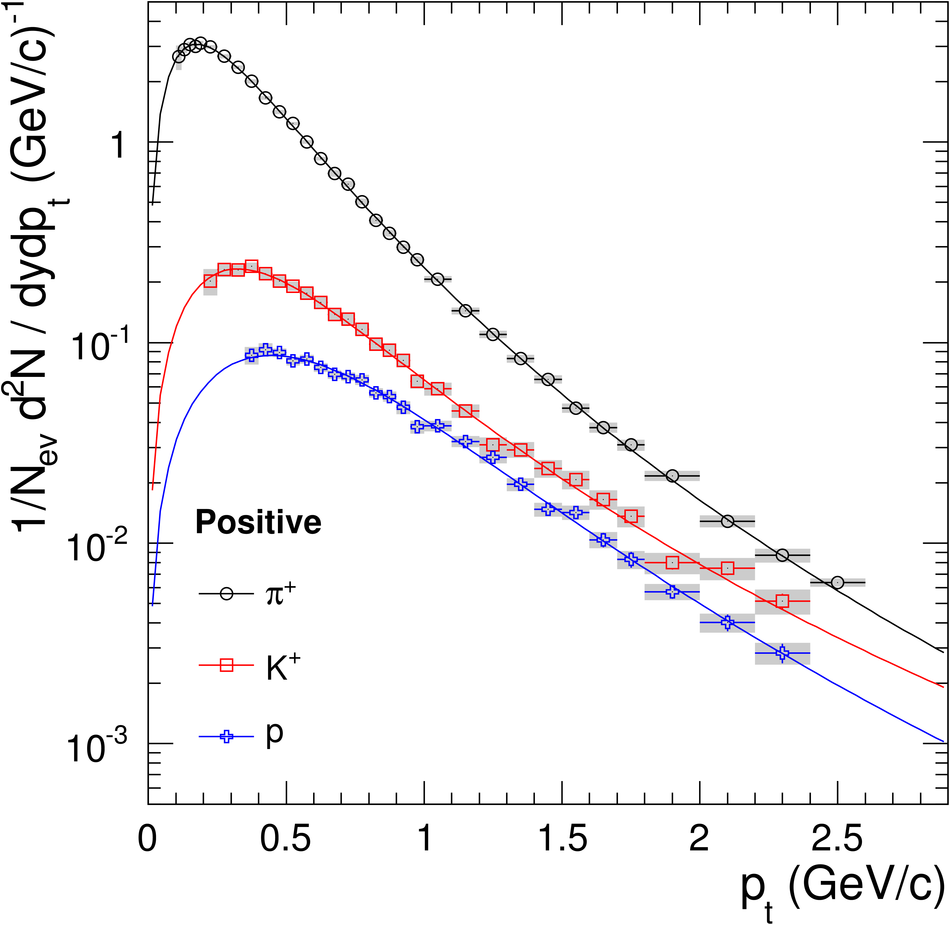
Transverse momentum spectra of positive(top) and negative (bottom) hadrons from pp collisions at $\sqrt{s} = 900 $GeV. Grey bands: total $\pt$-dependent error (systematic plus statistical); normalization systematic error (3.6%) not shown The curves represent fits using a $L\grave{e}vy$ function.

Figure 15

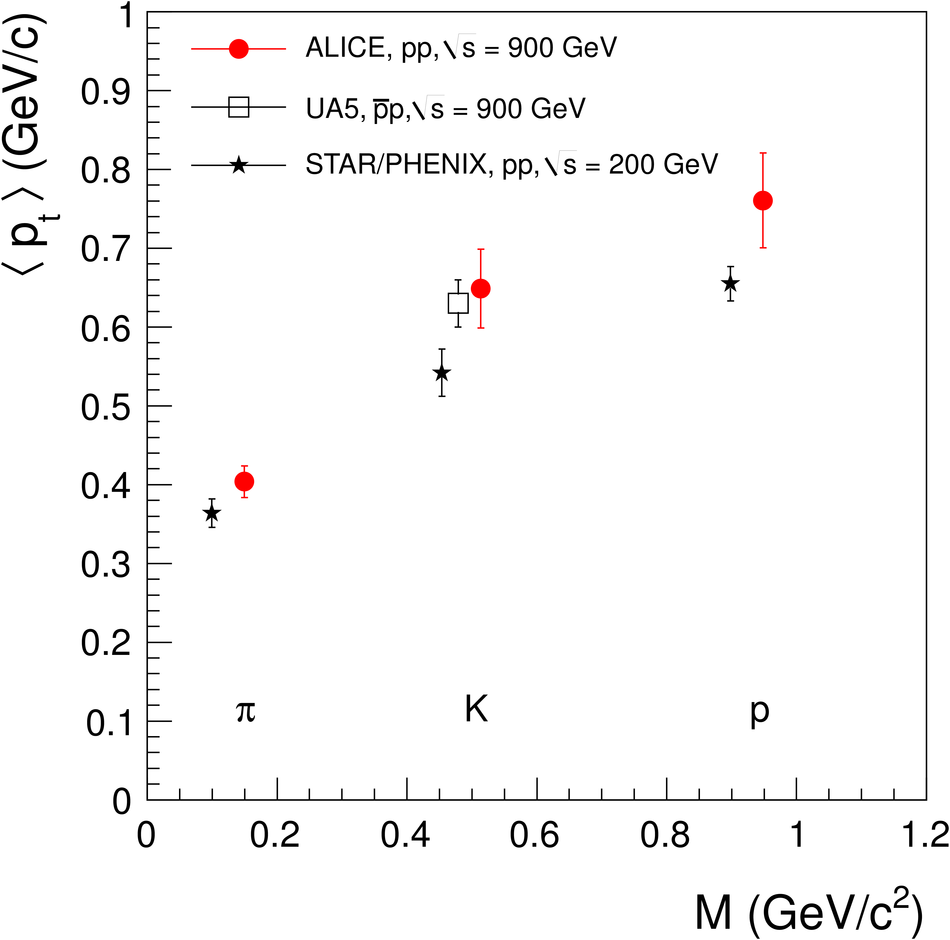
Mean $\pt$ as a function of the mass of the emitted particle in pp collisions at 900 GeV (ALICE, red solid circles, statistical and systematic errors) compared to results at $\sqrt{s} = 200 $GeV (star markers, average values of the results from the STAR and the PHENIX Collaborations [32,33]) and $\rm\overline{p}$p reactions at $\sqrt{s} = 900 $GeV (open squares). Some data points are displaced for clarity.

Figure 16

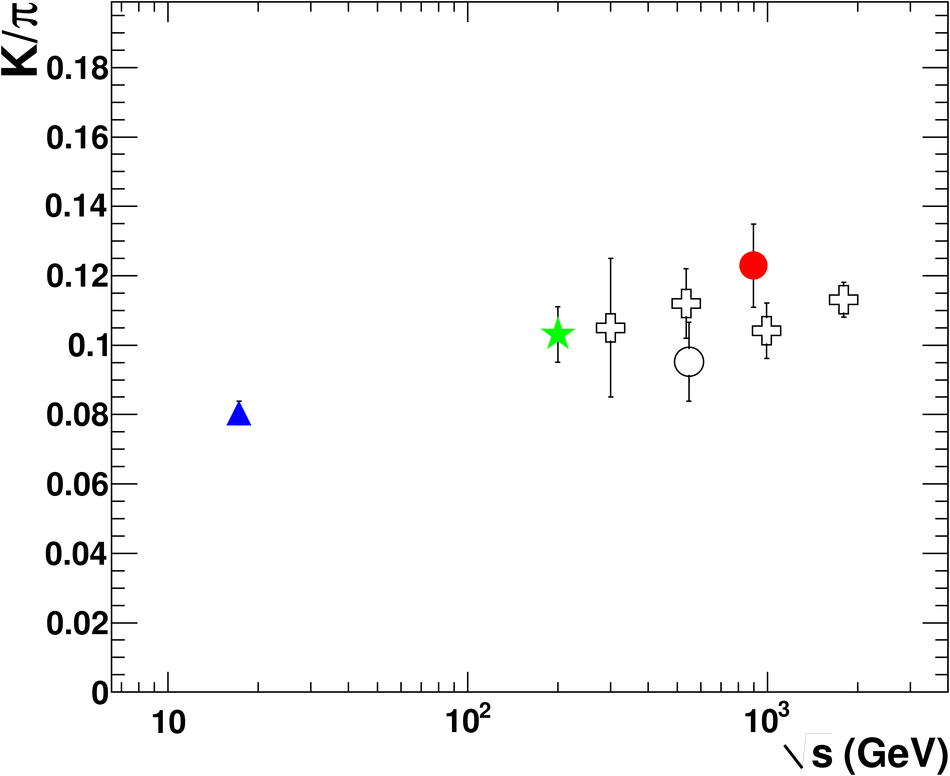
Ratios ($K^+$ + $K^-$) / ($\pi^+$ + $\pi^-$) and K$^0/\pi$ as a function of $\sqrt{s}$. Data (full symbols) are from pp collisions, (at $\sqrt{s}$ = 17.9 GeV by NA49 [34,35], at $\sqrt{s}$ = 200 GeV by STAR [32] and at $\sqrt{s}$ = 900 ALICE, present work) and(open symbols) from $\rm\overline{p}$p interaction (at $\sqrt{s}$ = 560 GeV by UA5 [37] and at the TEVATRON by E735 [36,38]).

Figure 17

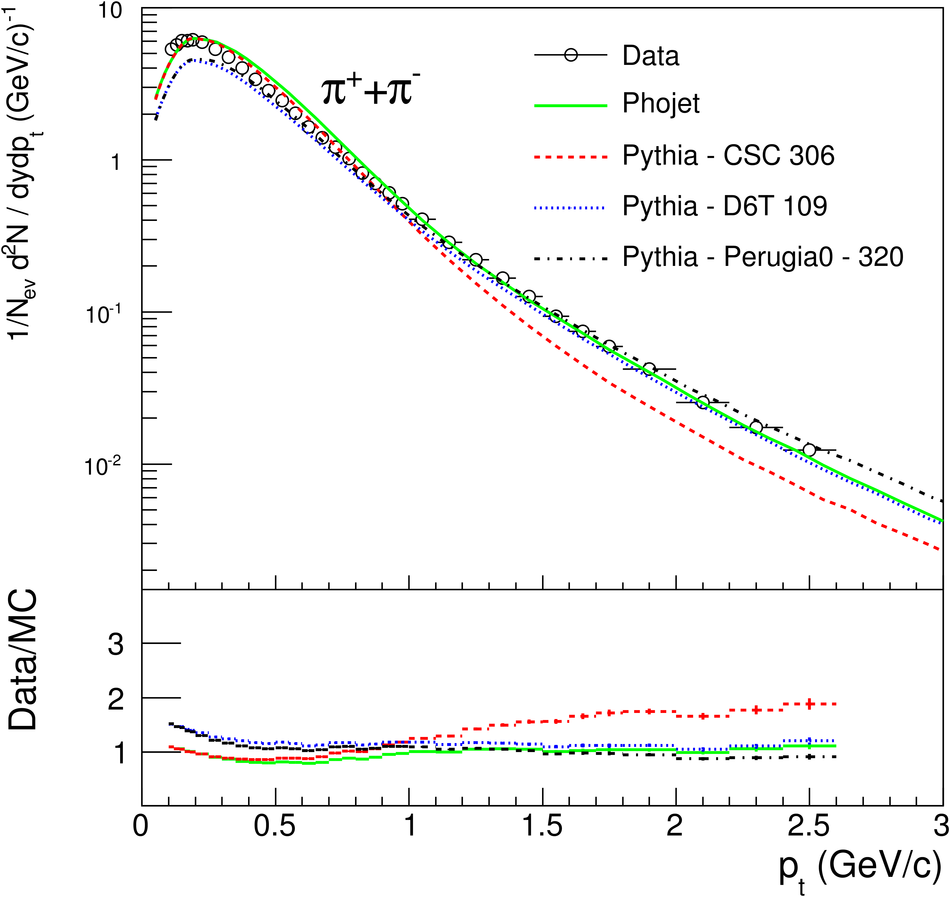
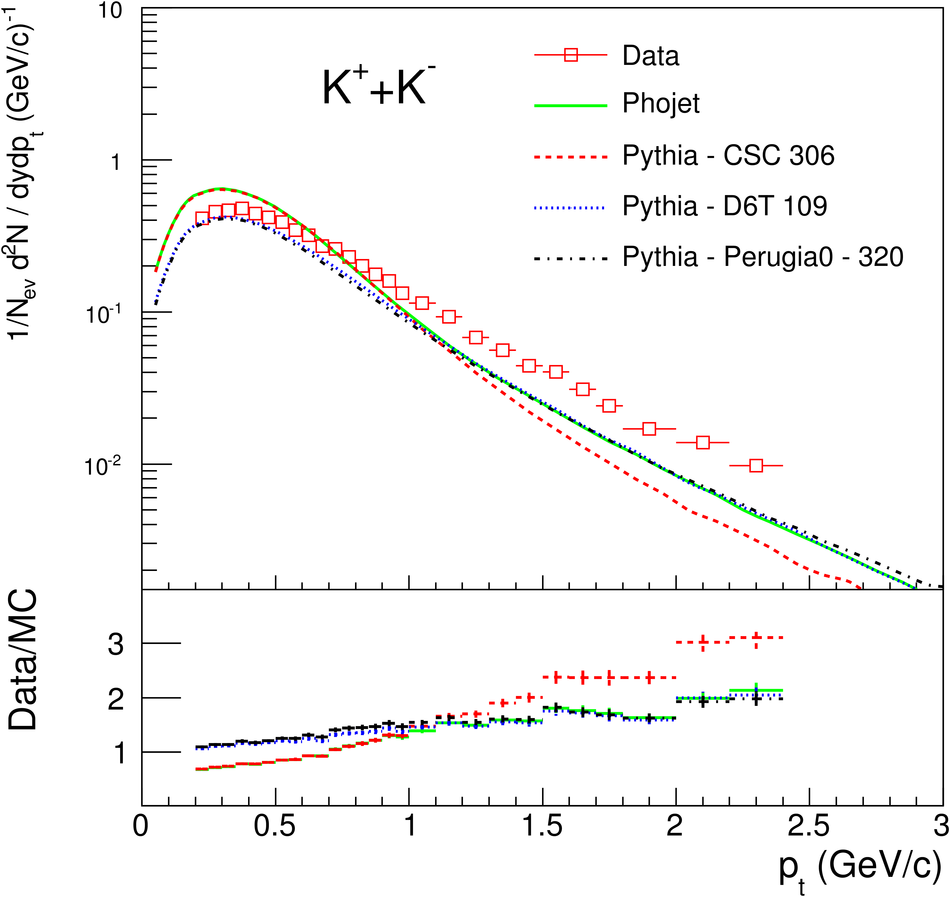
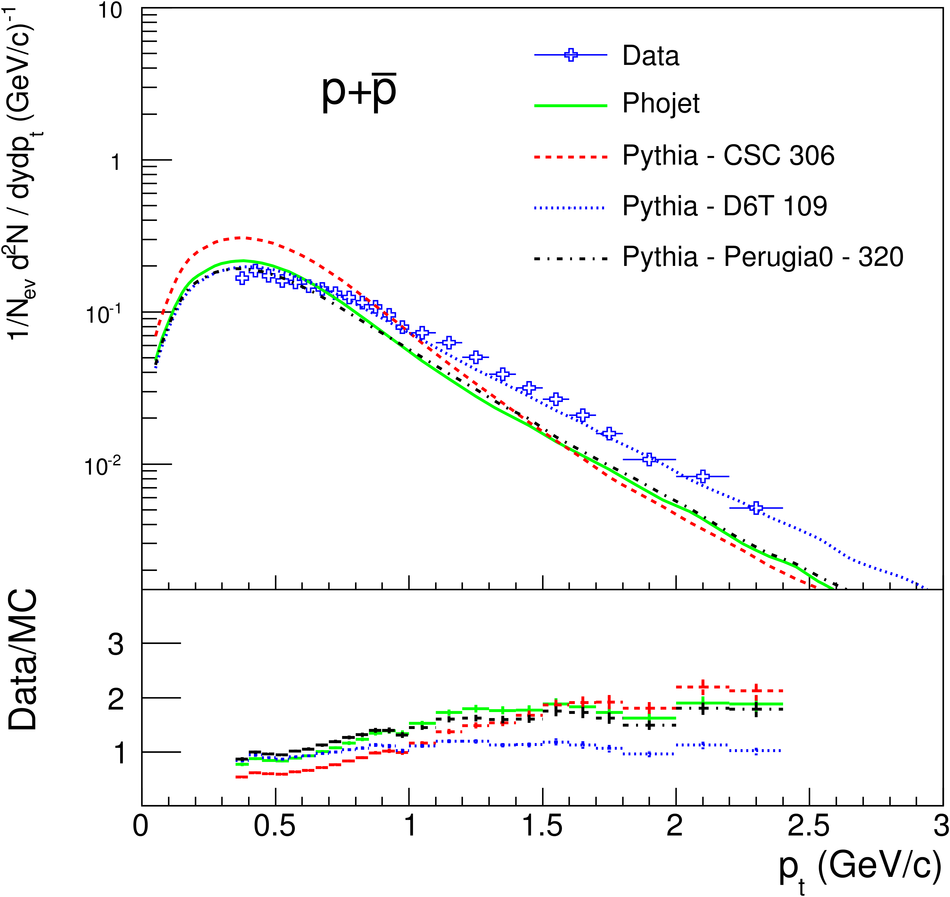
Comparison of measured pion, kaon and proton spectra at $\sqrt{s}$ = 900 GeV (both charges combined) with various tunes of event generators. Statistical errors only. Se etext for details.

Figure 18

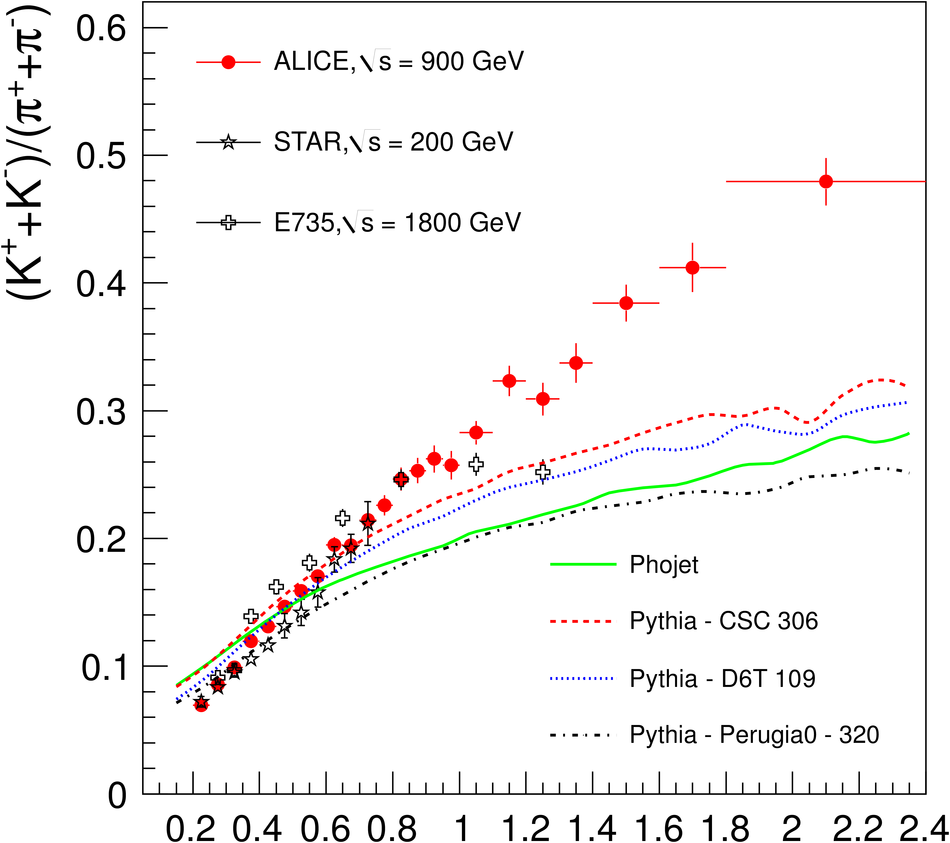
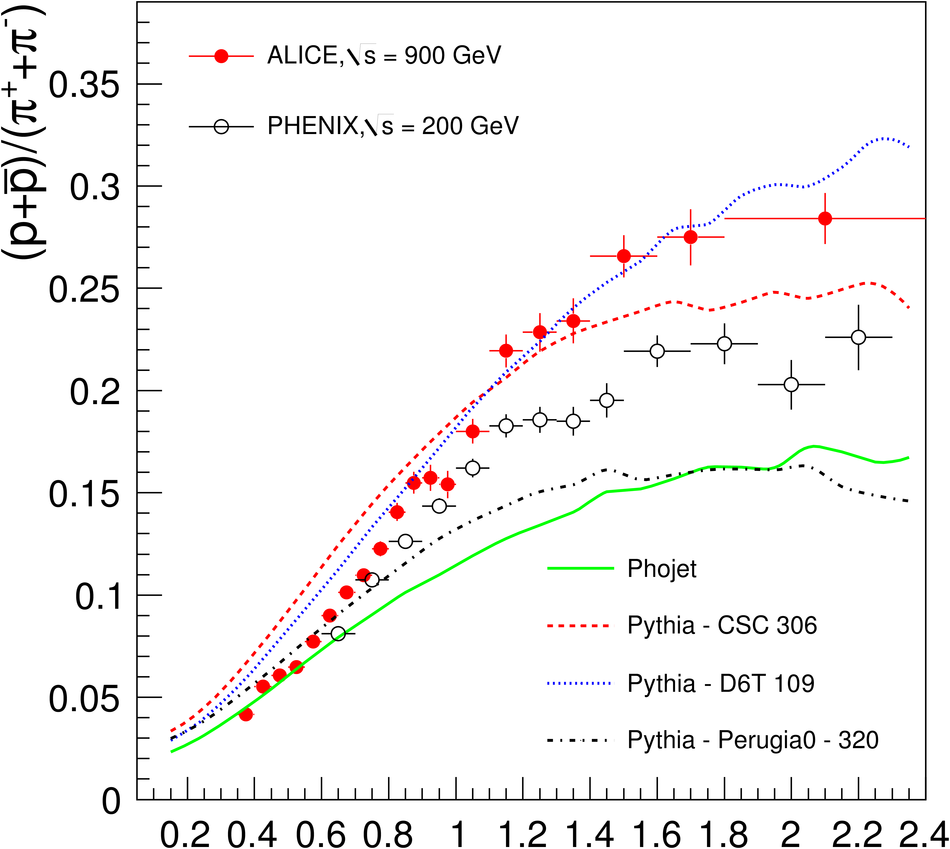
Ratios of ($K^+$ + $K^-$) / ($\pi^+$ + $\pi^-$)(upper panel) and (p + $\rm\overline{p}$) / ($\pi^+$ + $\pi^-$) (lower panel) as a function of $\pt$ from pp collisions at $\sqrt{s}$ = 900 GeV (statistical errors only). Values from the E735Collaboration [36] and the STAR Collaboration [32] (upper part) and from the PHENIX Collaboration [41] (lower part) also are given. The dashed and dotted curves refer to calculations using PYTHIA and PHOJET at $\sqrt{s}$ = 900 GeV.