Measured deuteron (filled dots) $B_2$ as a function of the transverse momentumper nucleon (\pt/A) (top left panel) and \vtwo(\pt) parameter (top right panel)compared to those produced with two versions of the AMPT model (dashed and dotted lines) In the bottom panels, the ratios between the measured data and the expectations fromthe two models are shown. |  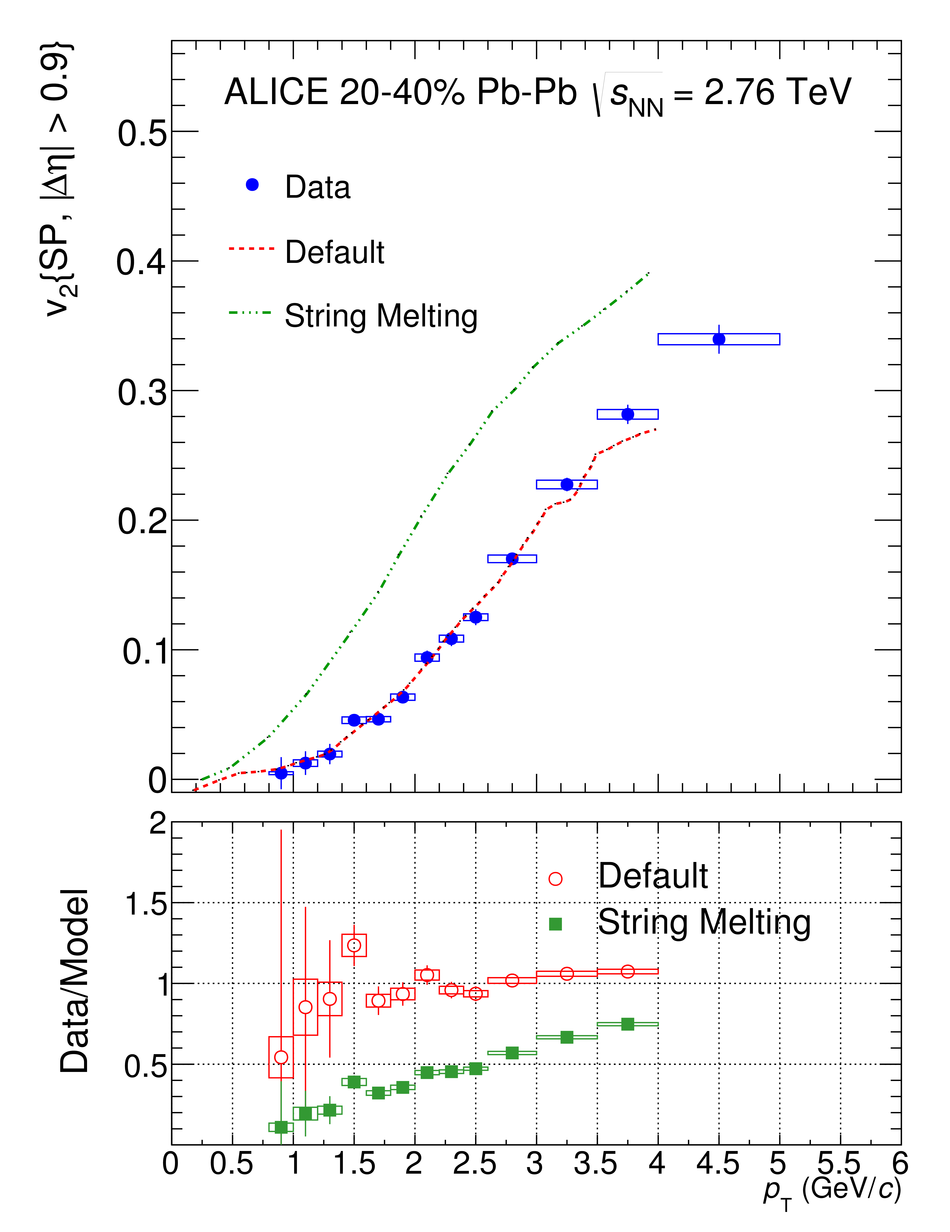 |