Left: Distribution of $\Delta \rm{M}$ for d+\dbar\ in the $2.2 \leq$ \pt $< 2.4$ \gmom\and centrality interval 30-40\% fitted with a Gaussian with an exponential used to reproduce the signal andan exponential to reproduce the background Right: The \vtwo$^{\rm{Tot}}$ vs $\Delta \rm{M}$ for d+\dbar\ for 2.2 $\leq$ \pt $< $ 2.4 \gmom\in events with 30-40\% centrality. Points represent the measured $v_2^{\mathrm{Tot}}$,while the curve is the fit performed using equation \ref{eq:v2tot}. | 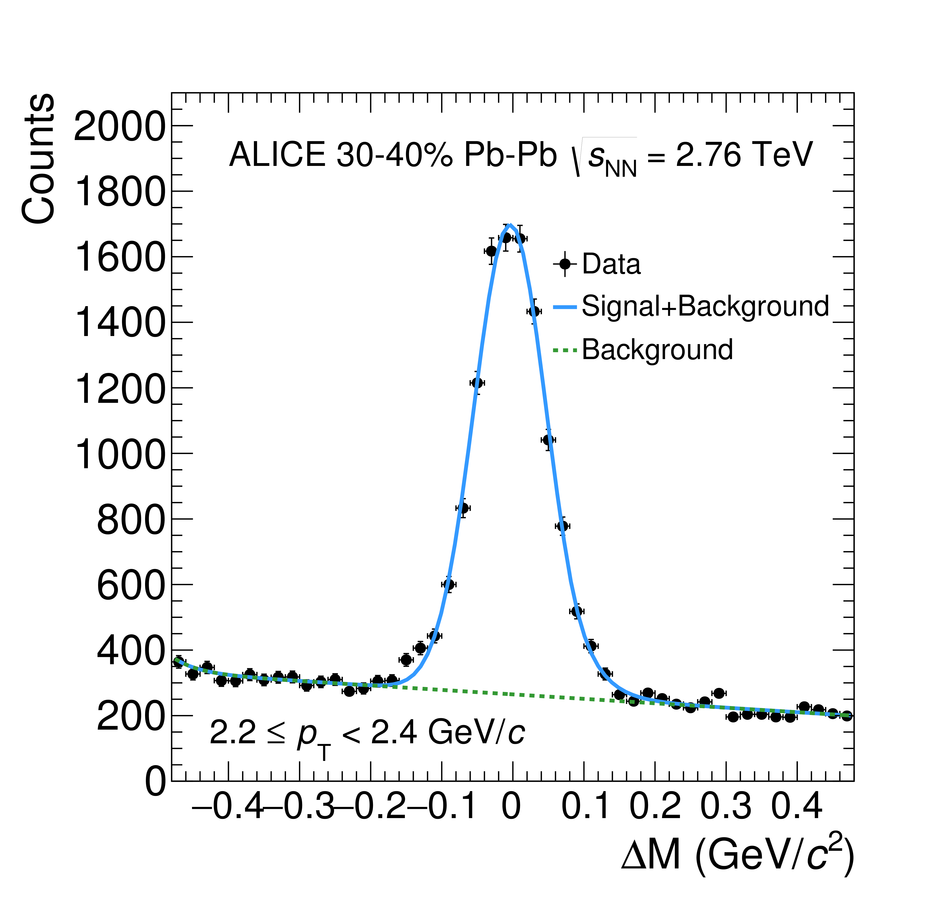 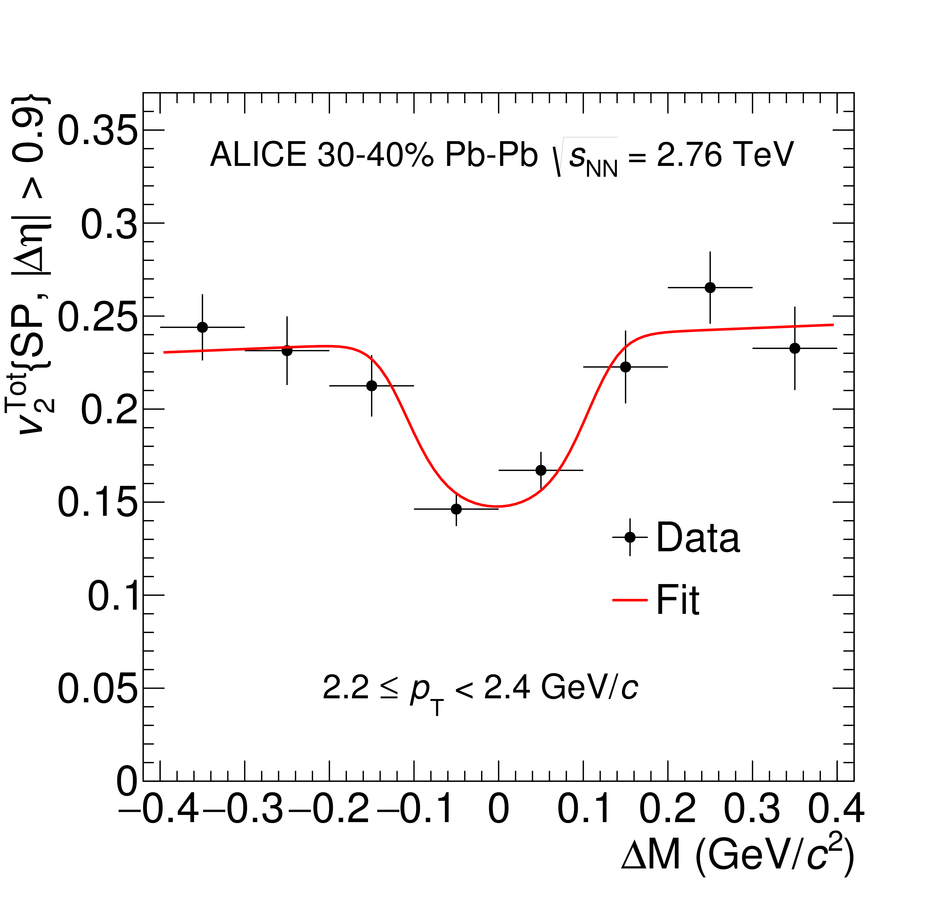 |