Upper panel: $\pt$-differential production cross section of muons from heavy flavour decays in five rapidity regions mentioned in the figures The error bars (empty boxes) represent the statistical (systematic) uncertainties. A 3.5$\%$ normalization uncertainty is not shown. The solid curves are FONLL calculations and the bands display the theoretical systematic uncertainty. Lower panel: ratio between data and FONLL calculations. | 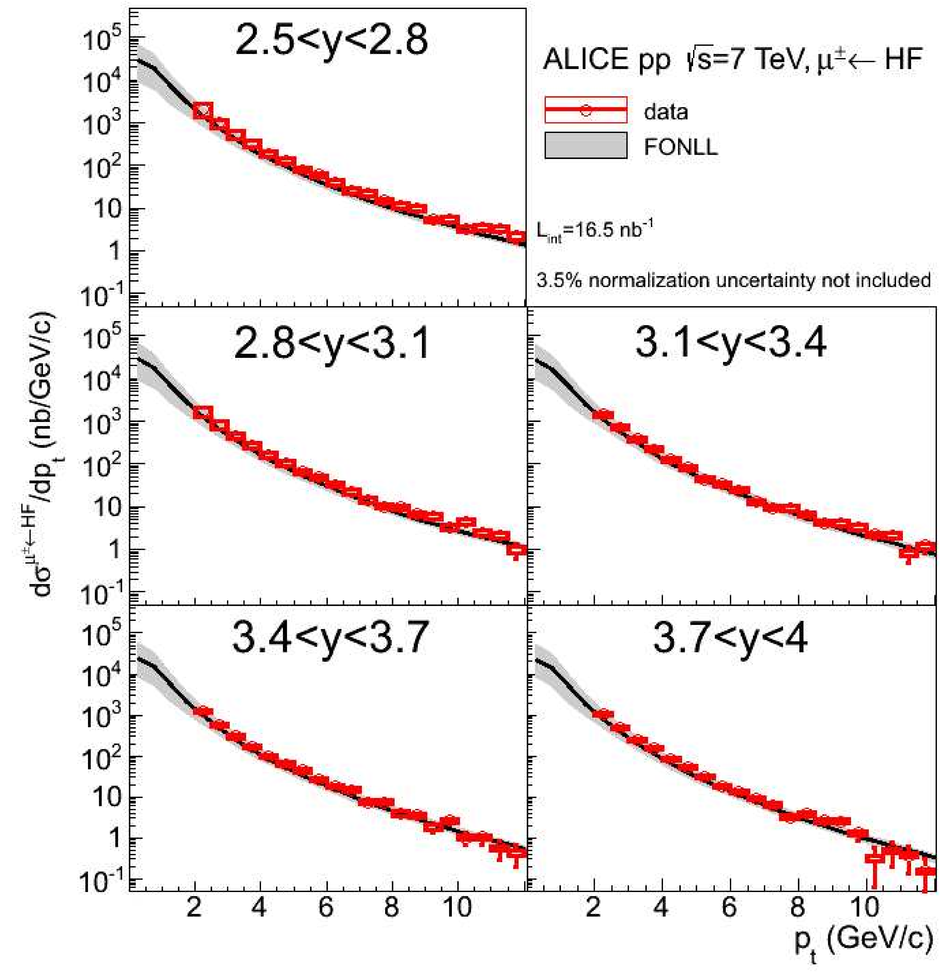 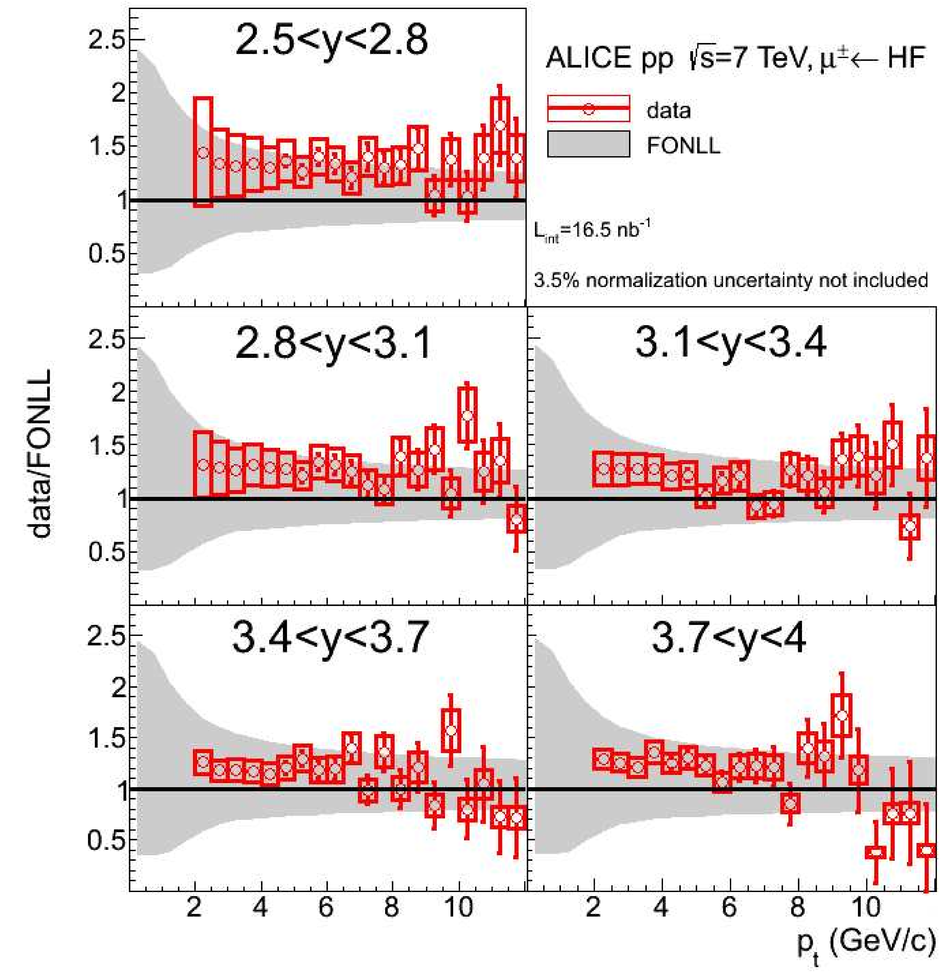 |