Invariant mass distributions of US dimuons with $2.5 < y < 4$ and $p_{\rm T}< 12$ GeV/$c$ The top (bottom) row shows the distribution before (after) background subtraction with the event-mixing technique. The left panels correspond to the most central events (0-10%) while the right panels to a peripheral (70-80%) centrality range. The fit curves shown in blue represent the sum of the signal and background shapes, while the red lines correspond to the J/$\psi$ signal and the grey ones to the background. | 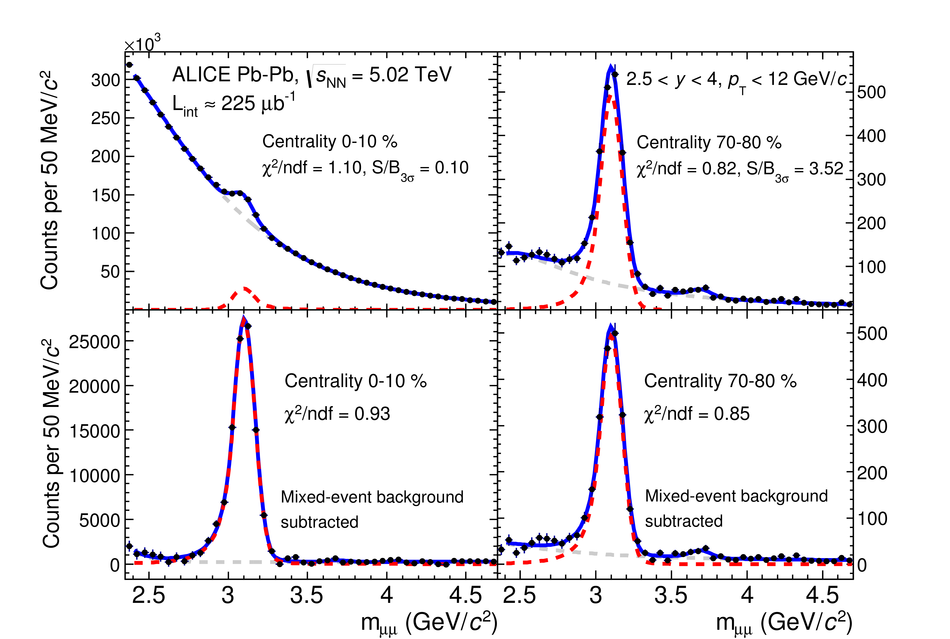 |