Comparison with models of measured multiplicity distributions for the \inel event class in the pseudorapidity range $|\eta| < 1.0$: ALICE data (black circles with grey bands), PYTHIA6 tune Perugia0 (red continuous line), PHOJET (blue dot-dashed line), PYTHIA6 Perugia 2011 (pink dashed line), PYTHIA8 4C (green dashed line), and EPOS LHC (long dashed light blue line). The shaded areas represent total uncertainties: comparison at 0.9 (left) and at 7 TeV (right). The ratios between measured values and model calculations are shown in the lower parts of the figures with the same convention. | 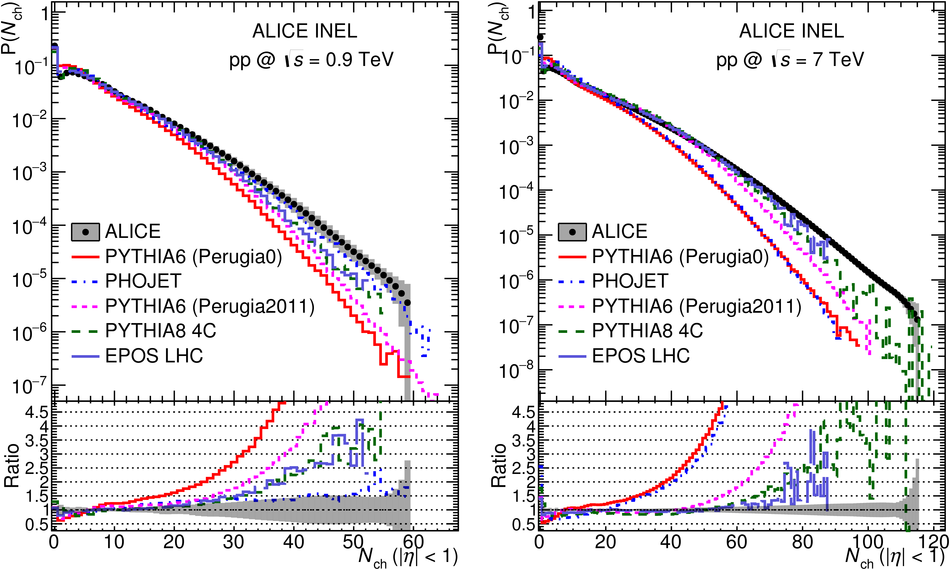 |