Comparison with ALICE previous publications, for the INEL event class, at $\sqrt{s} = 0.9$ TeV (top left) and the INEL$>$0 event class at $\sqrt{s} = 7$ TeV (top right); in both cases, ratios between ALICE new data and ALICE previous data are also shown. The total uncertainties are shown as error bars for the previous data and as a band for the present measurement. For the NSD event class, comparison with ALICE previous publication and with CMS data at $\sqrt{s} = 0.9$ TeV (bottom left), and comparison with CMS data at $\sqrt{s} = 7$ TeV (bottom right); ratios of the NBD fits of ALICE data taken without errors to CMS data, for the various $\eta$ intervals (indicated on the figure), are also shown. Error bars represent the contributions of the CMS errors to the ratios, the bands represent the ALICE total uncertainty assigned to the ratio of 1. | 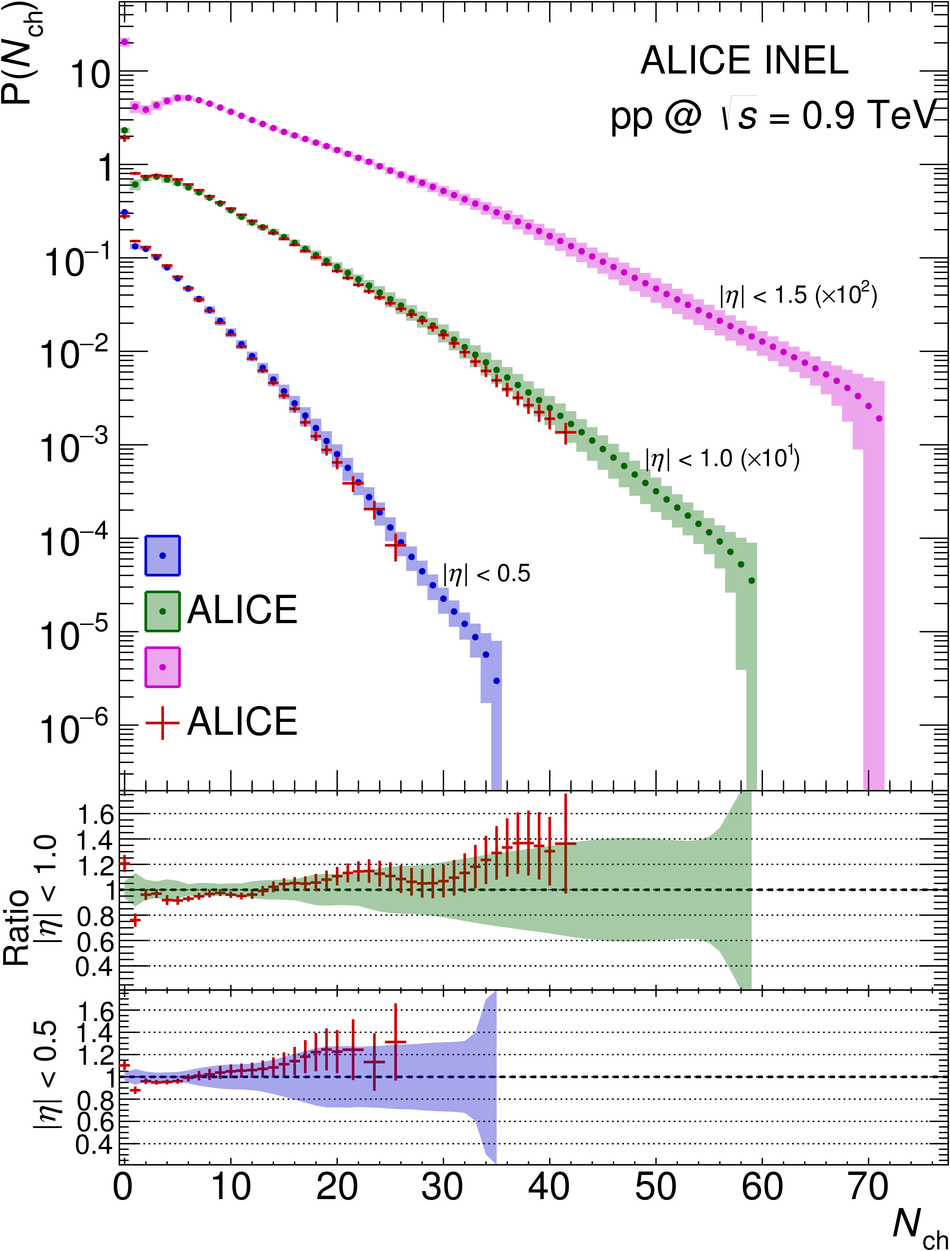 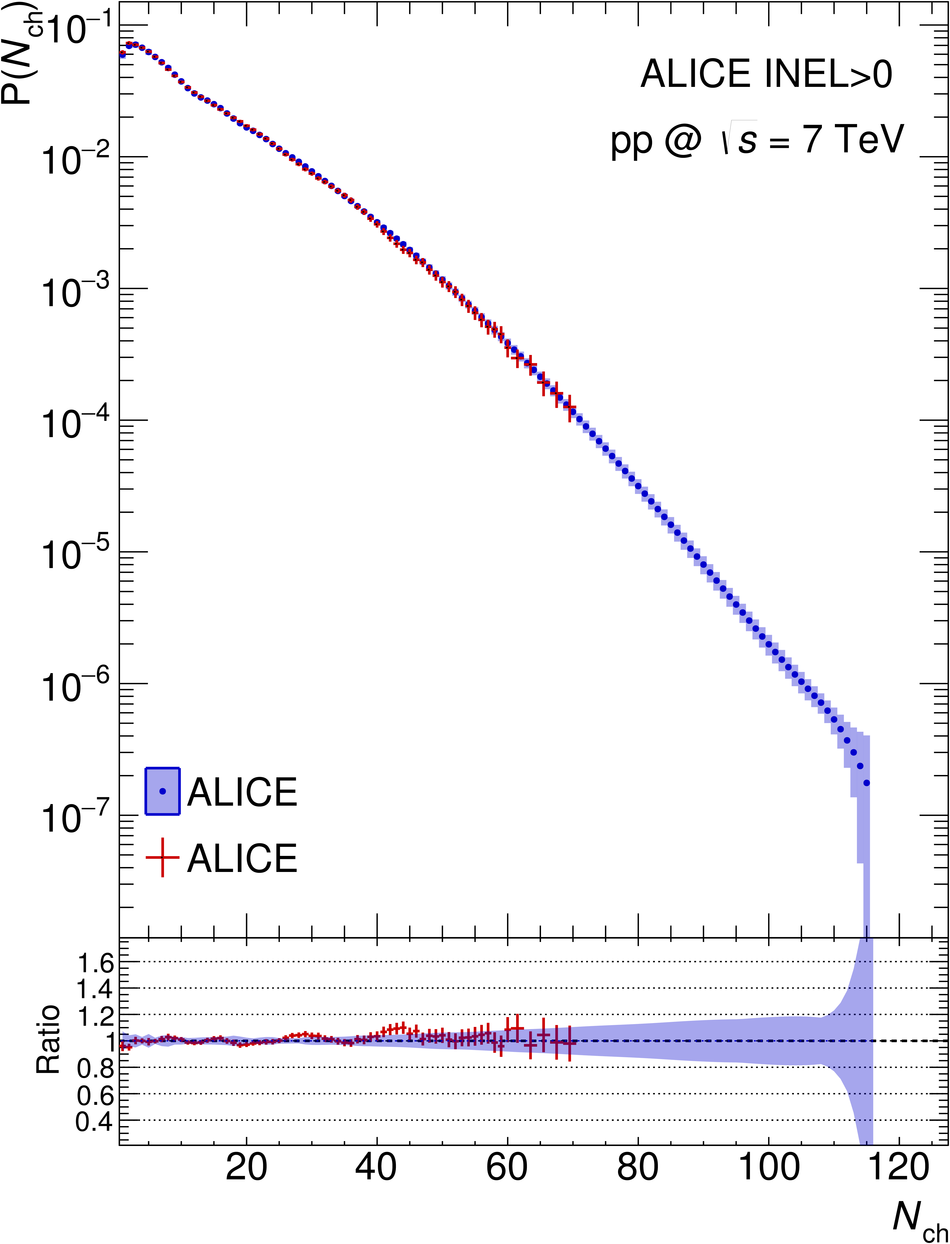  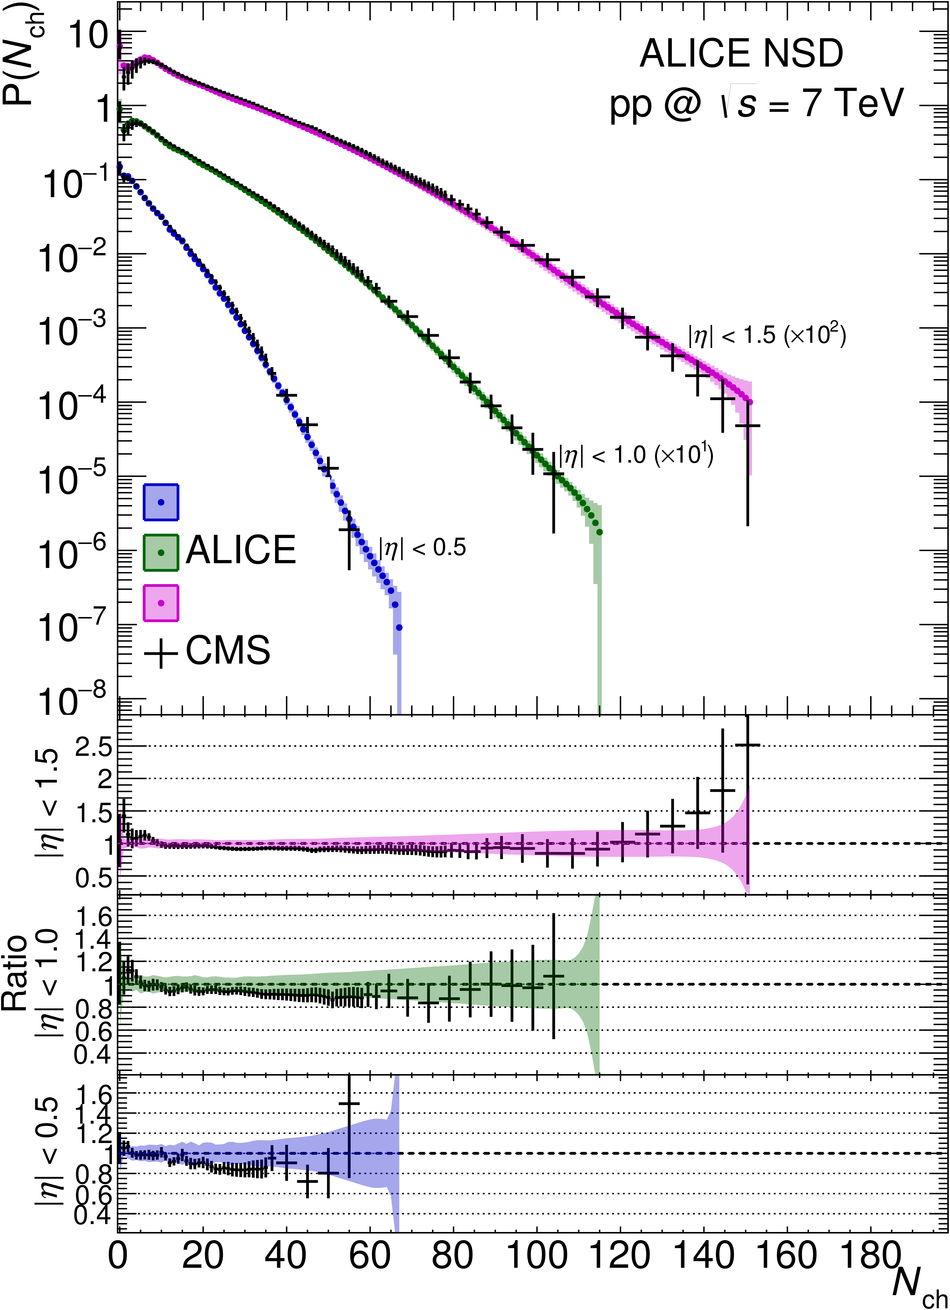 |