Measured multiplicity distributions in three pseudorapidity ranges for NSD events. The dashed and solid lines show the single and double NBD fits (see Section 9.5). Shaded areas represent statistical and systematic uncertainties combined: (a) data at $\sqrt{s} = 0.9$ TeV (top left); (b) data at $\sqrt{s} = 2.76$ TeV (top right); (c) data at $\sqrt{s} = 7$ TeV (bottom left); (d) data at $\sqrt{s} = 8$ TeV (bottom right). Ratios of data to the fits are also shown, with shaded areas representing combined systematic and statistical uncertainties. | 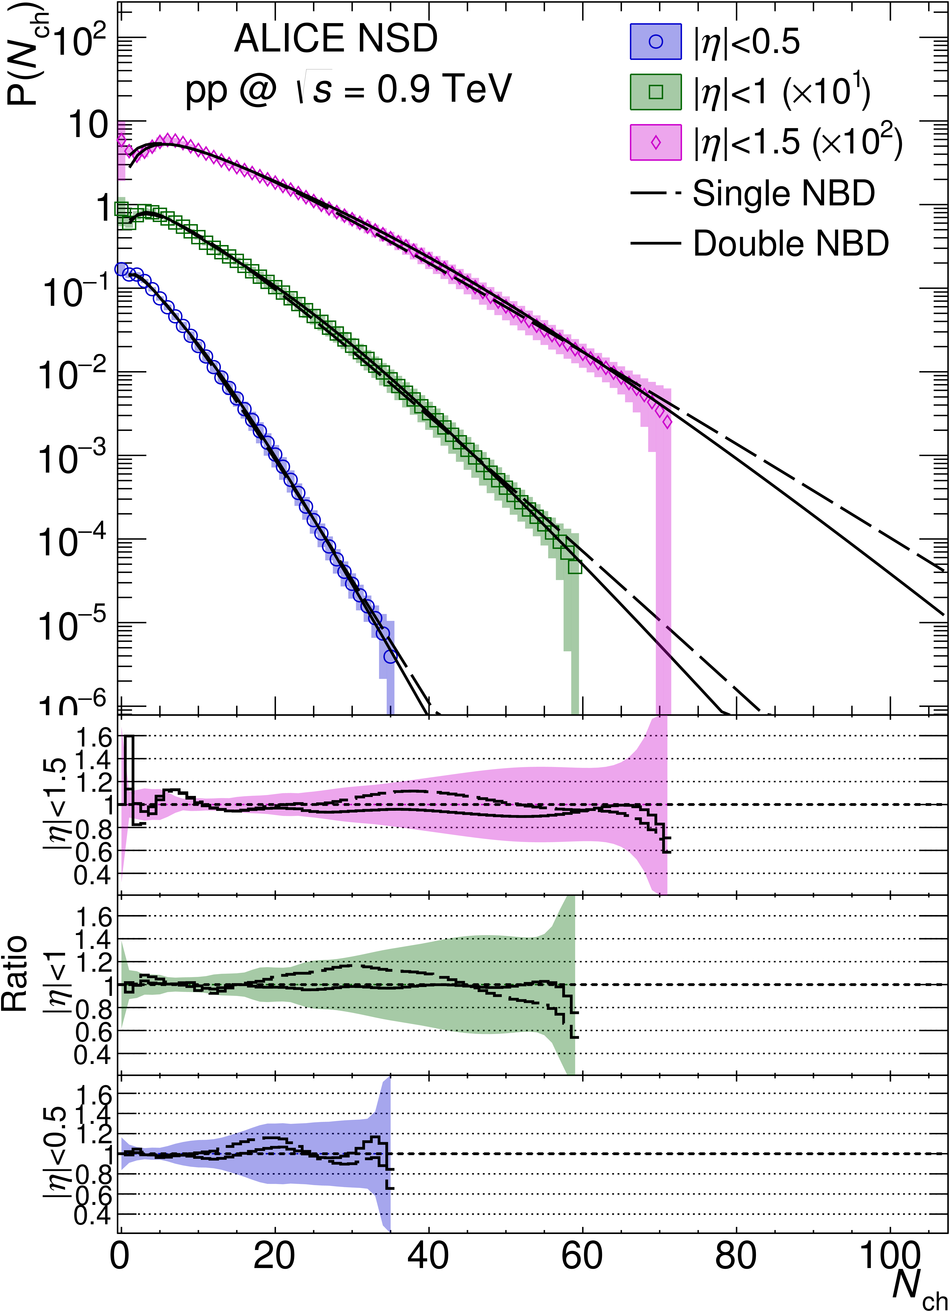 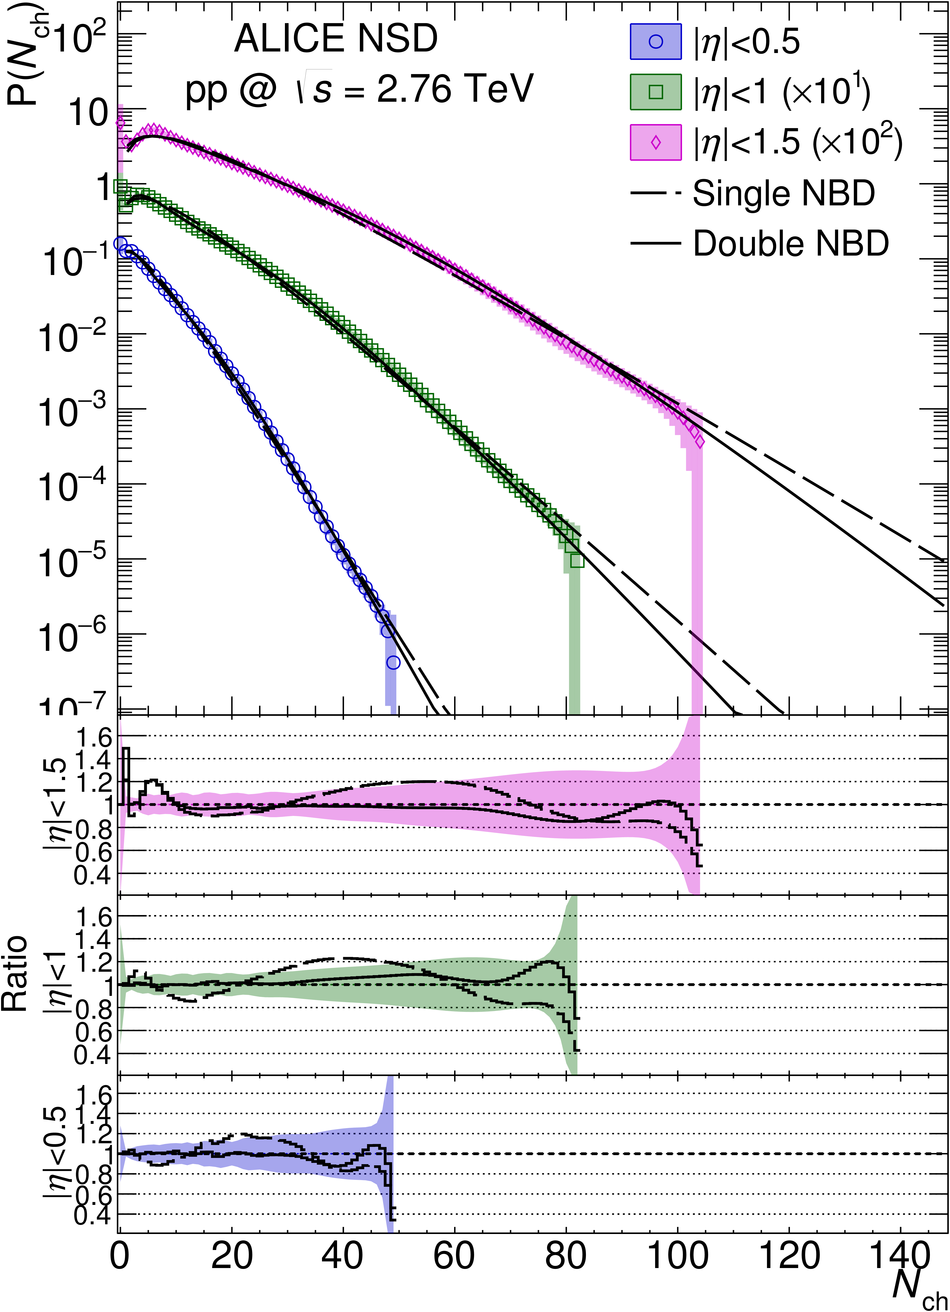  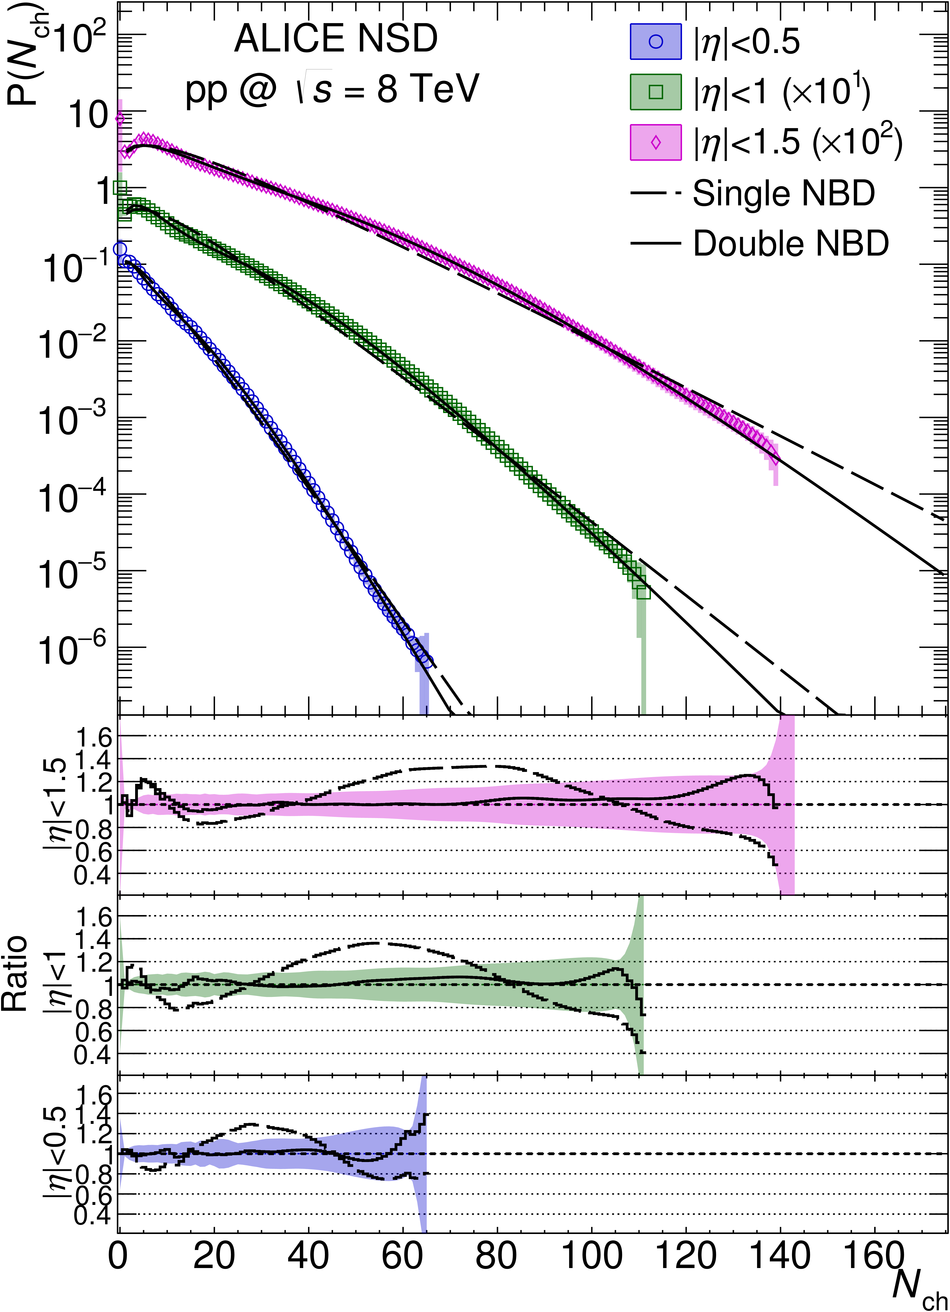 |