(left) At $\sqrt{s} = 7$ TeV, average raw $\pt$ vs. raw charged track multiplicity in $|\eta| < 1$, for data (black circles), PYTHIA6 Perugia0 (blue dashed line) and ATLAS-CSC (red dotted line). The bottom part of the figure shows the ratios of the two simulated distributions to the data; (right) Comparison of ${\rm d}\nch$/${\rm d}\eta$ evaluations, as a function of $\eta$, using correction maps obtained with (a) PYTHIA6 Perugia0 (blue dashed line), (b) PYTHIA6 ATLAS-CSC (red dotted line) and (c) the average between (a) and (b); The bottom part of the figure shows the ratios of corrected distributions from (a) and (b) to the average. | 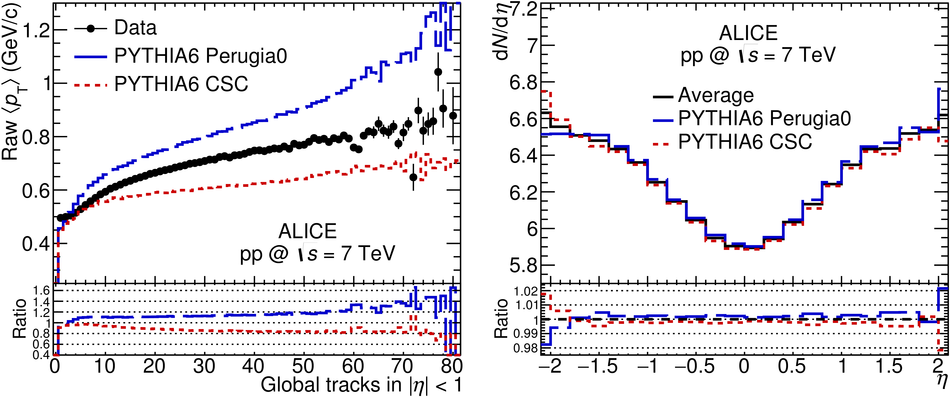 |