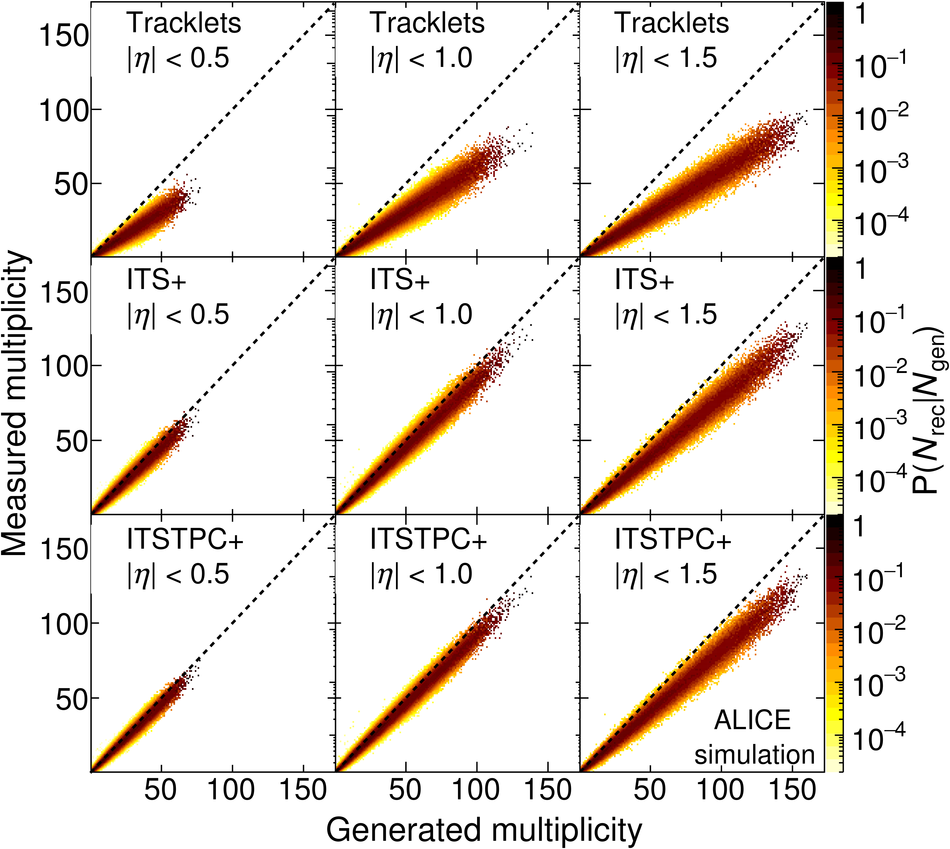
Graphical representation of the detector response matrices obtained with PYTHIA6 CSC combined with a simulation of the ALICE detector, at $\sqrt{s} = 7$ TeV, for three pseudorapidity intervals ($|\eta| < $ 0.5, 1.0, and 1.5 from left to right, respectively), and for the three track counting algorithms, Tracklet, ITS$+$ and ITSTPC$+$, from top to bottom, respectively. Horizontal axes show generated primary charged-particle multiplicities and vertical axes measured multiplicities. |  |