Invariant mass distribution for $\overline{\mathrm{d}}\pi^{+}$ for the Pb--Pb data corresponding to $ 19.3 \times 10^{6}$ central events. The arrow indicates the sum of the mass of the constituents ($\overline{\Lambda\mathrm{n}}$) of the assumed bound state. A signal for the bound state is expected in the region below this sum. The dashed line represents an exponential fit outside the expected signal region to estimate the background. | 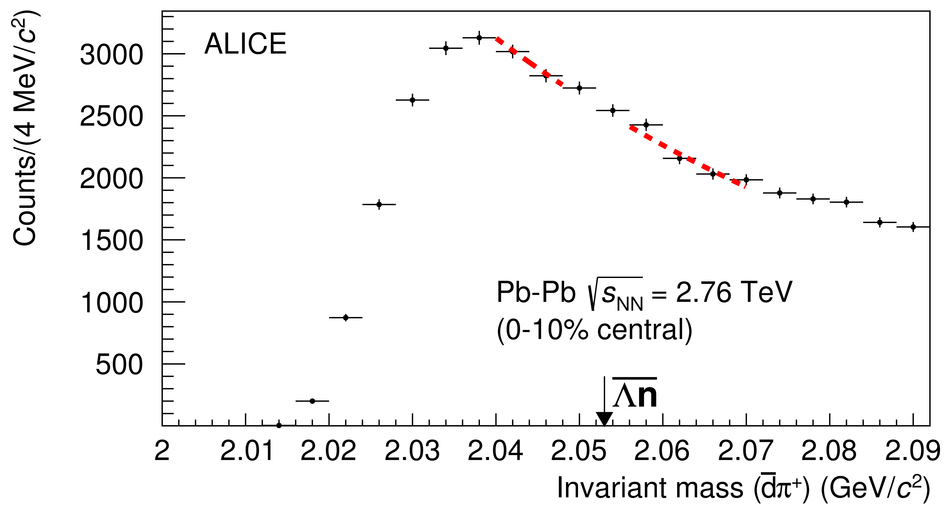 |