The invariant differential cross sections for inclusive $\pi^{0}$ and $\eta$ mesons at midrapidity were measured in pp collisions at $\sqrt{s}=2.76$ TeV for transverse momenta $0.4<~p_{\rm T}<~40$ GeV/$c$ and $0.6<~p_{\rm T}<~20$ GeV/$c$, respectively, using the ALICE detector. This large range in $p_{\rm T}$ was achieved by combining various analysis techniques and different triggers involving the electromagnetic calorimeter (EMCal). In particular, a new single-cluster, shower-shape based method was developed for the identification of high-$p_{\rm T}$ neutral pions, which exploits that the showers originating from their decay photons overlap in the EMCal. The measured cross sections are found to exhibit a similar power-law behavior with an exponent of about $6.3$. Next-to-leading-order perturbative QCD calculations differ from the measured cross sections by about $30$% for the $\pi^0$, and between $30$-$50$% for the $\eta$ meson, while generator-level simulations with PYTHIA 8.2 describe the data to better than $10$-$30$%, except at $p_{\rm T}<~1$ GeV/$c$. The new data can therefore be used to further improve the theoretical description of $\pi^{0}$ and $\eta$ meson production.
Eur. Phys. J. C 77 (2017) 339
HEP Data
e-Print: arXiv:1702.00917 | PDF | inSPIRE
CERN-EP-2017-019
Figure 1
Energy dependence of ratios between cluster spectra for EMC1/INT1, EMC7/INT7, EG2/EMC7 and EG1/EG2. The trigger names INT1 and INT7 denote the minimum bias triggers MB$_{\rm OR}$ and MB$_{\rm AND}$ respectively. The trigger names EMC1, EMC7, EG2 and EG1 denote the EMCal triggers at L0 in 2011 and 2013, and the EMCal triggers at L1 in 2013 with increasing threshold respectively. The individual trigger rejection factors and their respective fit ranges in the plateau region are indicated as well The final rejection factors with respect to the minimum bias trigger are given in Tab. 1. | 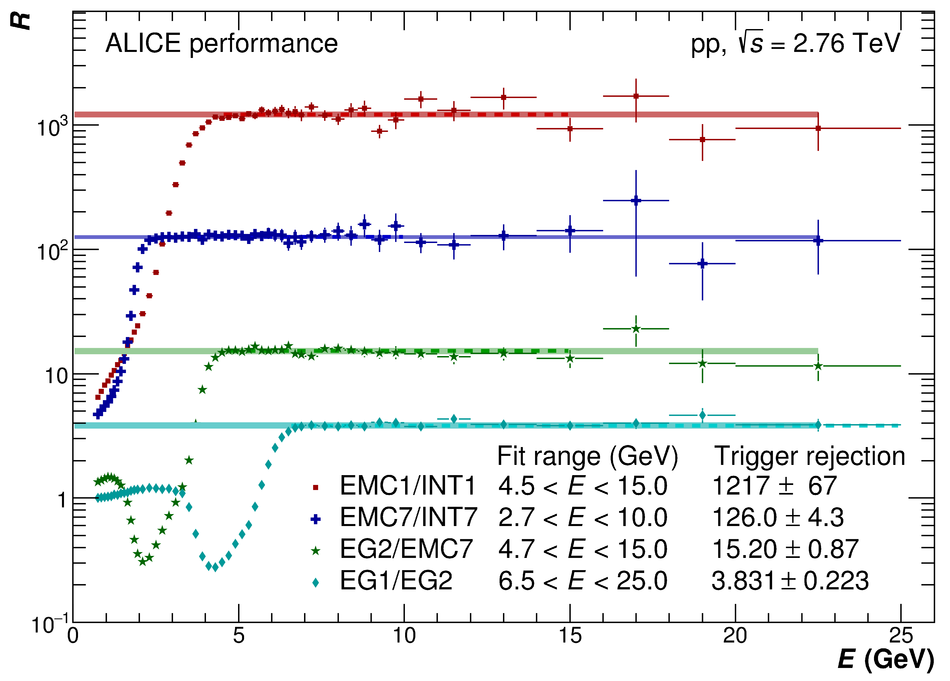 |


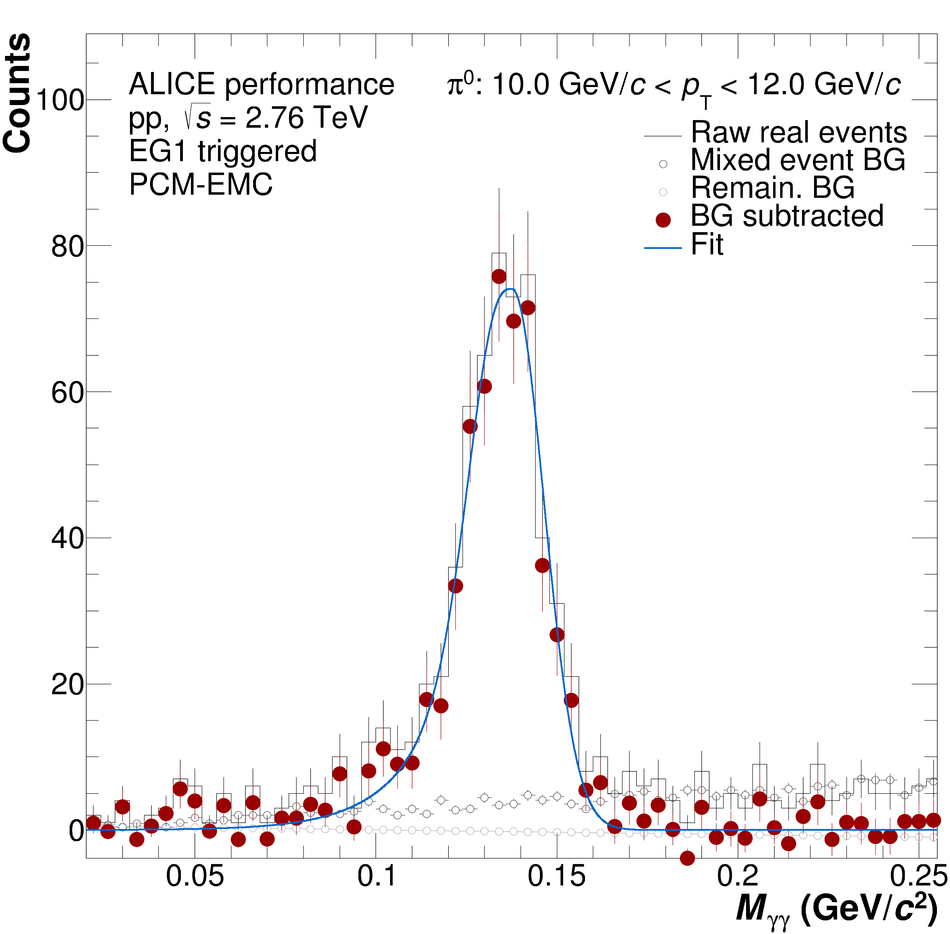
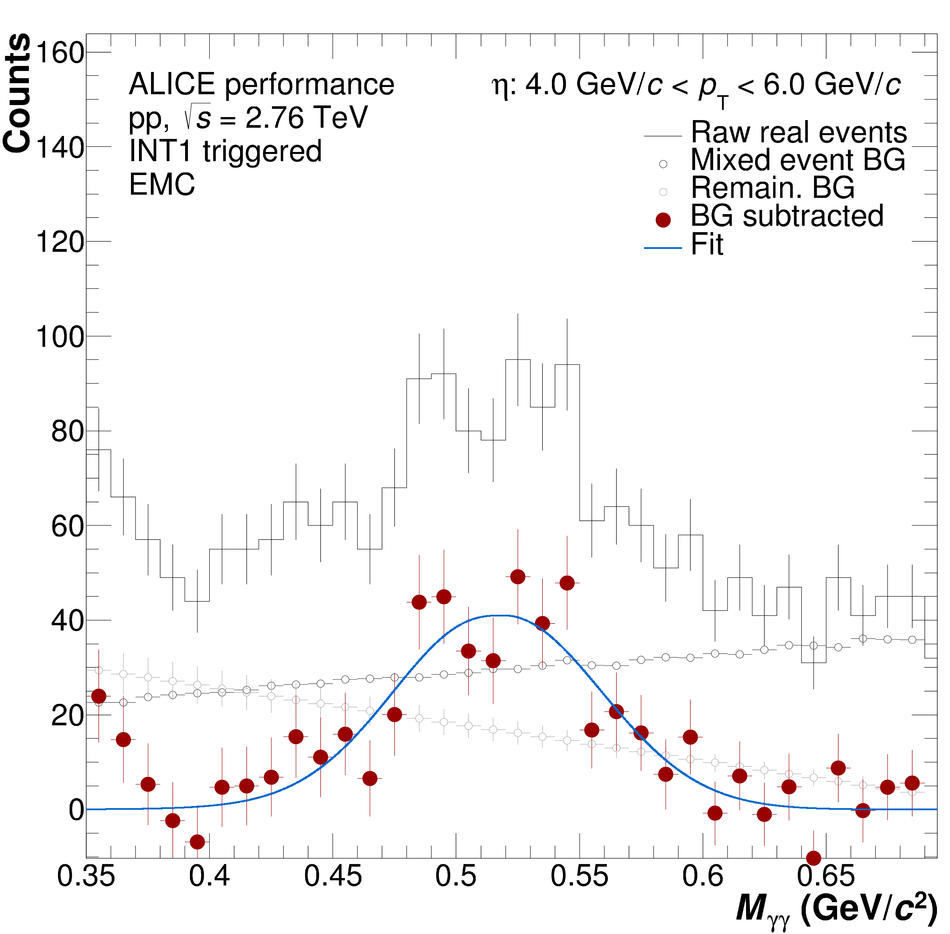
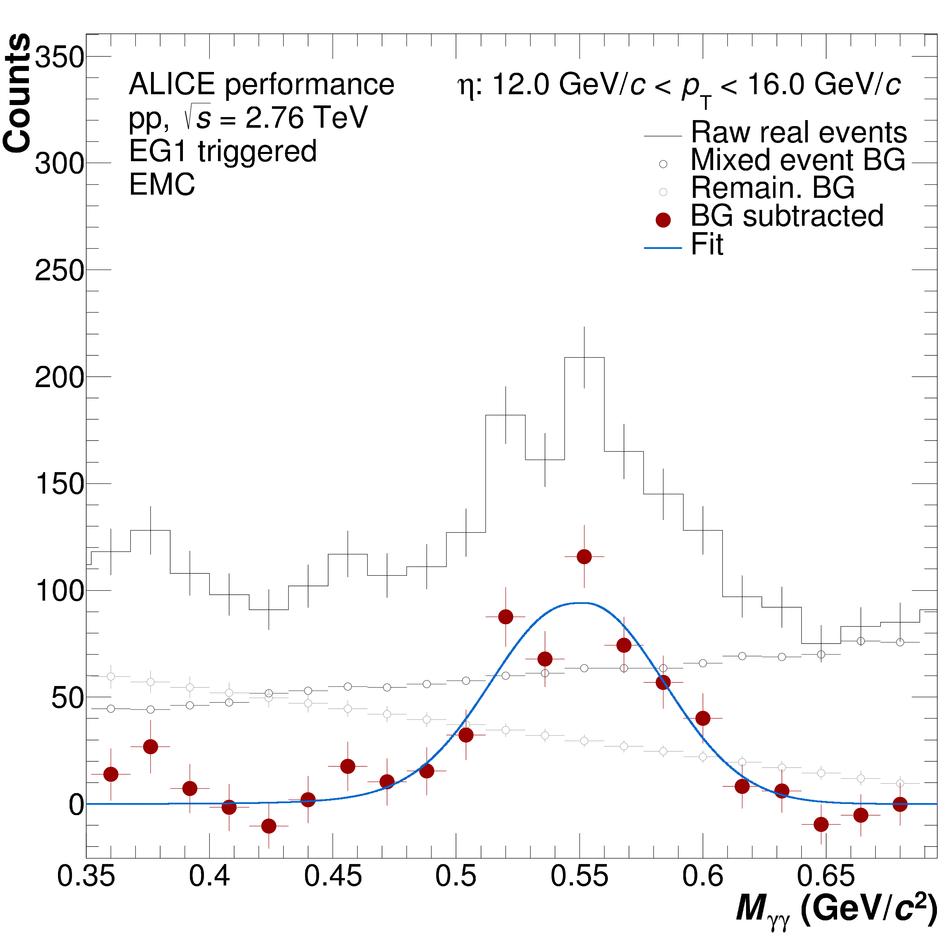
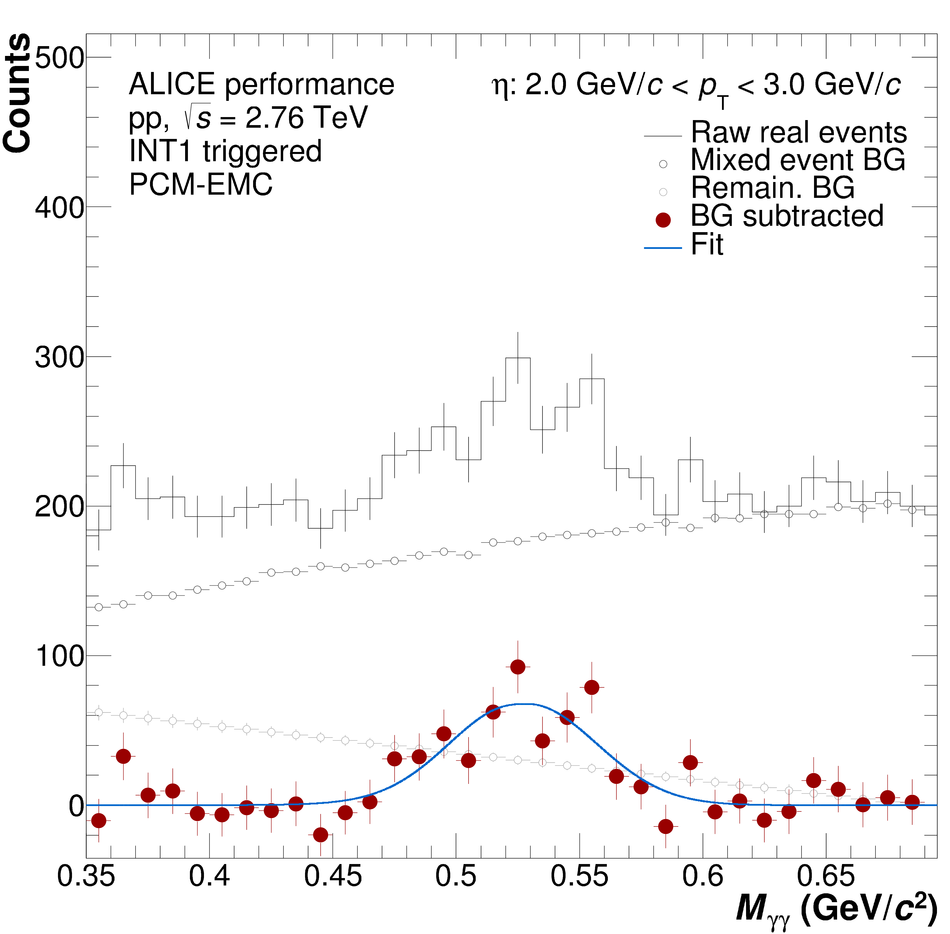
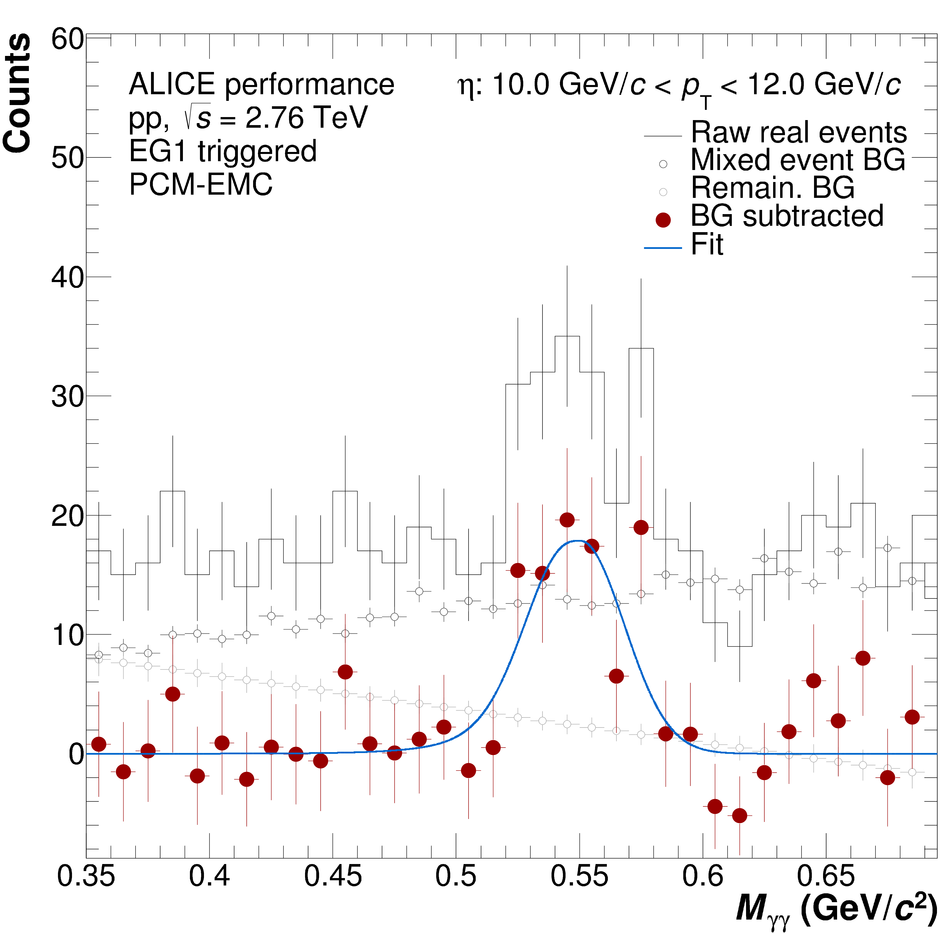
Figure 5
Neutral pion (left panels) and $\eta$ meson (right panels) mass position (bottom panels) and width (top panels) for the $\rm{PCM}$, $\rm{PCM-EMC}$ and $\rm EMC$ methods. The performance of PHOS for $\pi^0$ is taken from Ref. [5]. Data are displayed as closed symbols, simulations as open symbols. | 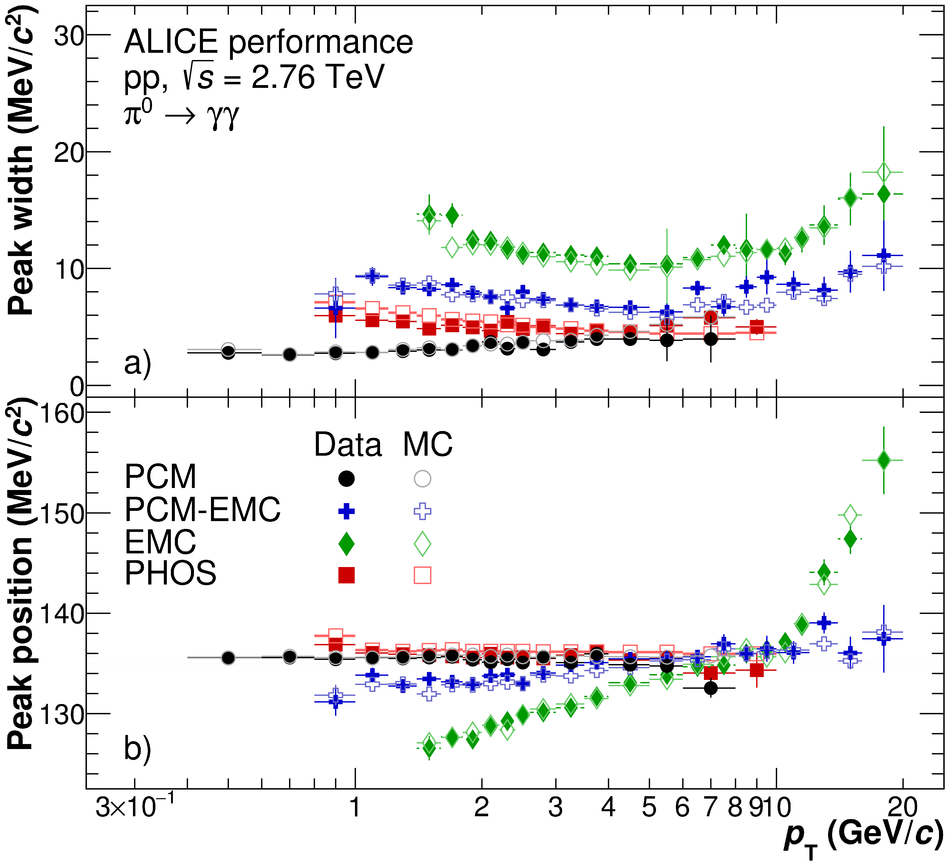 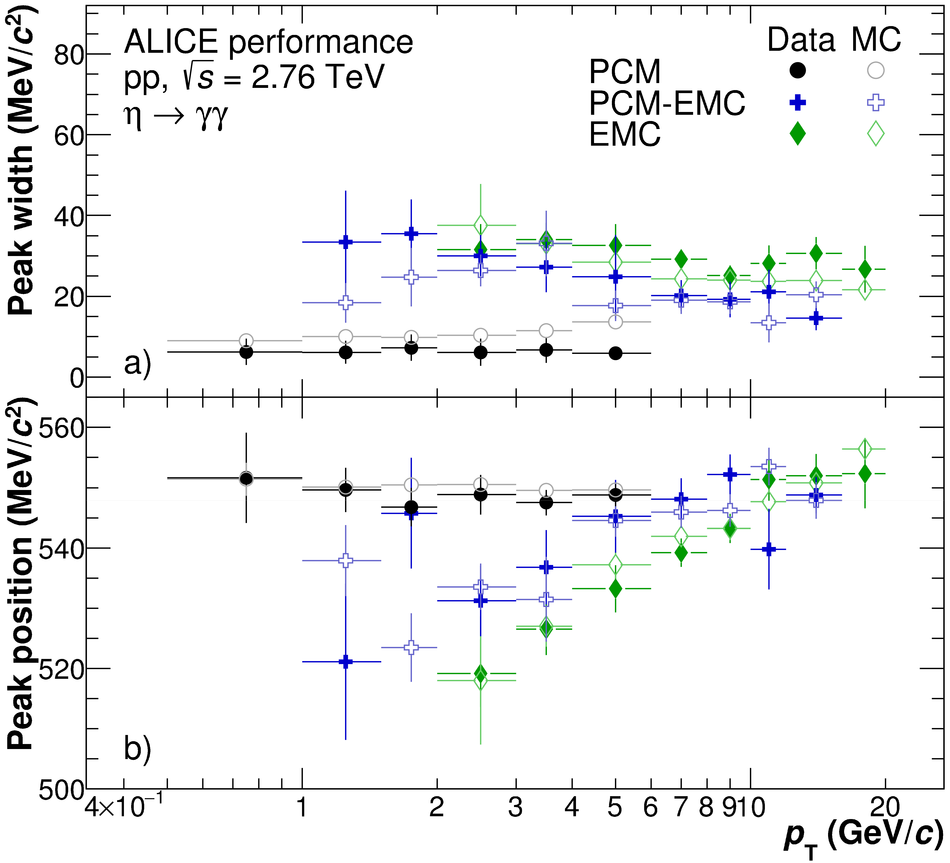 |
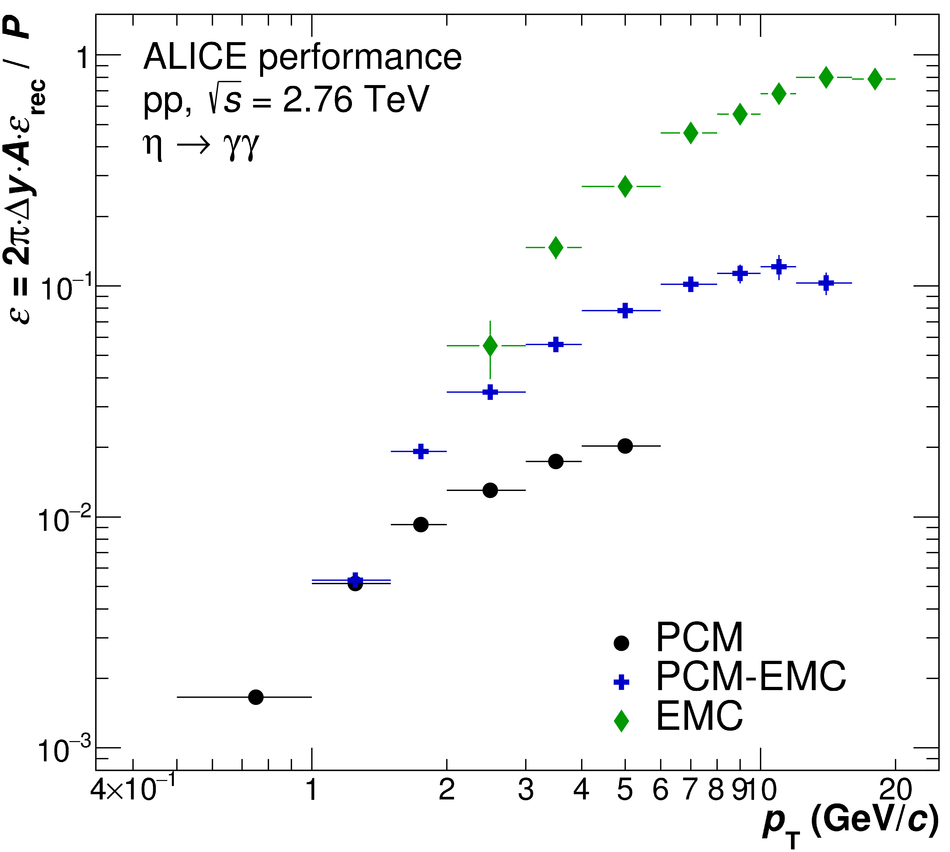


Figure 8
Comparison of the individual measurements in their respective measured transverse momentum ranges relative to the two-component model fits [25,26] of the final spectra. The final spectra are obtained by combining the individual measurements in the overlapping $\pt$ regions with the highest granularity using the full correlation matrix as defined in the BLUE-algorithm [27-29]. | 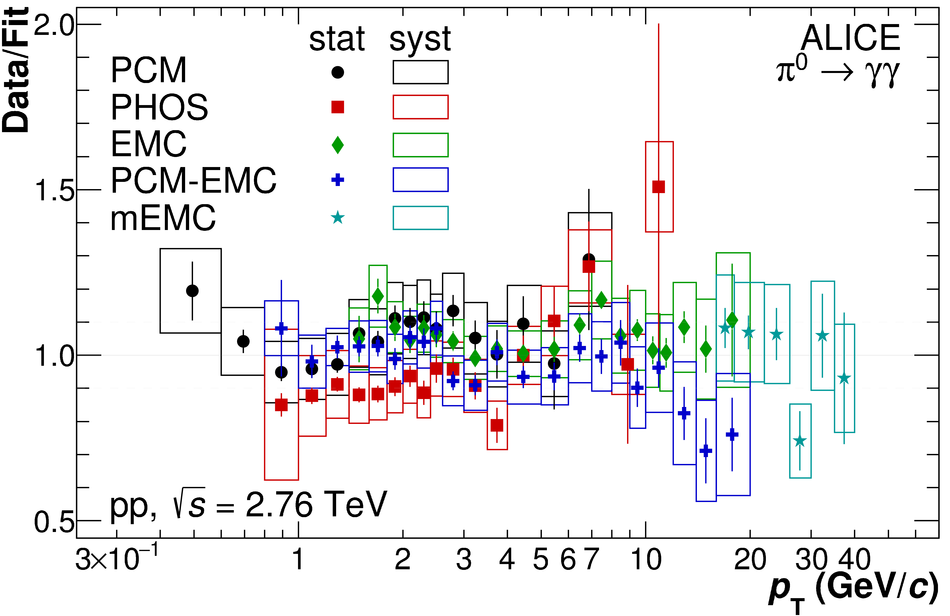  |
Figure 9
Invariant differential cross section of the $\pi^0$ (left, top panel) and $\eta$ meson (right, top panel) for pp collisions at $\sqrt{s} = 2.76$ TeV The data are compared to PYTHIA 8.2 generator-level simulations using the Monash 2013 tune as well as recent NLO pQCD calculations [3,6]. The ratios of the data and the calculations to the respective two-component model fits [25,26] to the data are shown in the lower panels The horizontal error bars denote statistical, the boxes systematic uncertainties. | 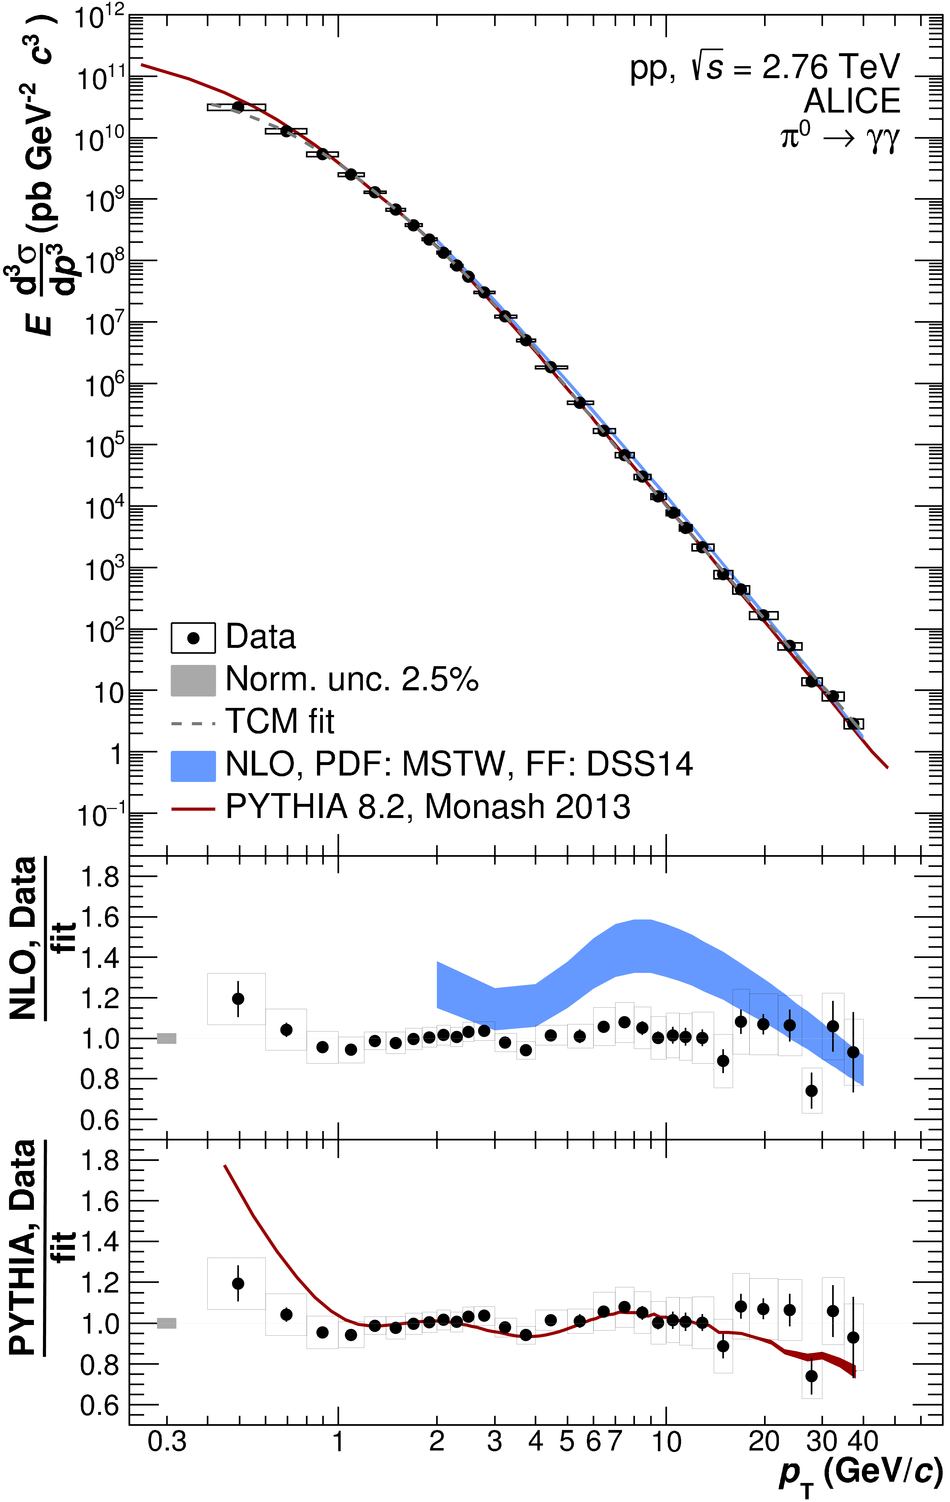 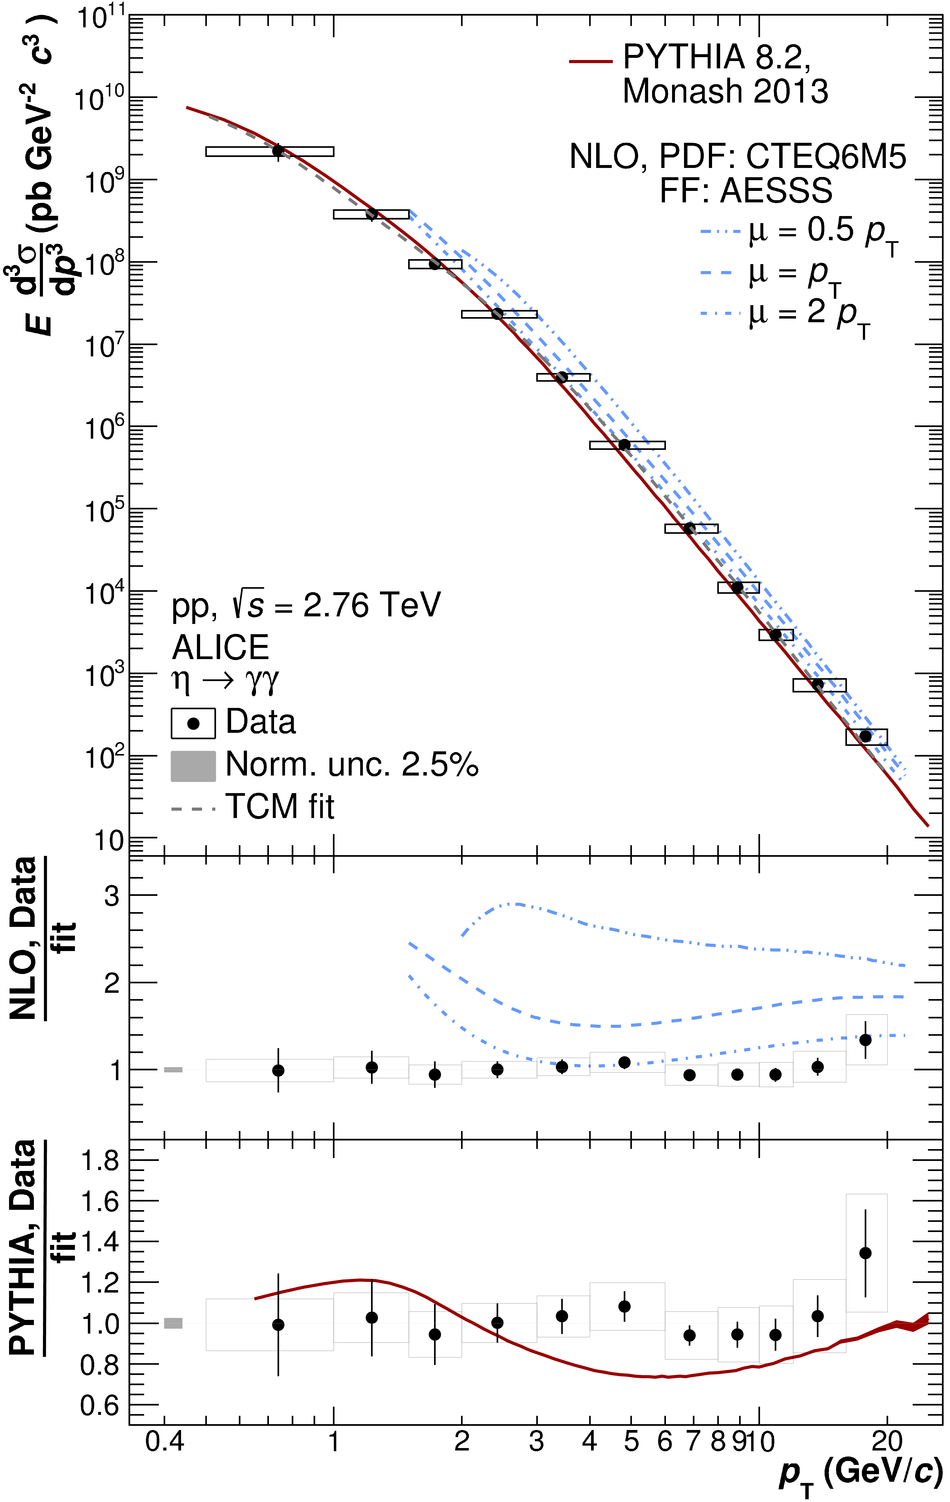 |
Figure 10
Measured $\eta/\pi^0$ ratio in pp collisions at $\sqrt{s} = 2.76$ TeV compared to NLO pQCD calculations [6,33] and PYTHIA 8.2 [14] generator-level simulations using the Monash 2013 tune. The horizontal error bars denote statistical, the boxes systematic uncertainties. The data at $\sqrt{s}=0.2$ TeV [34] and $\sqrt{s}=7$ TeV [4] are shown with statistical and systematic uncertainties added in quadrature. | 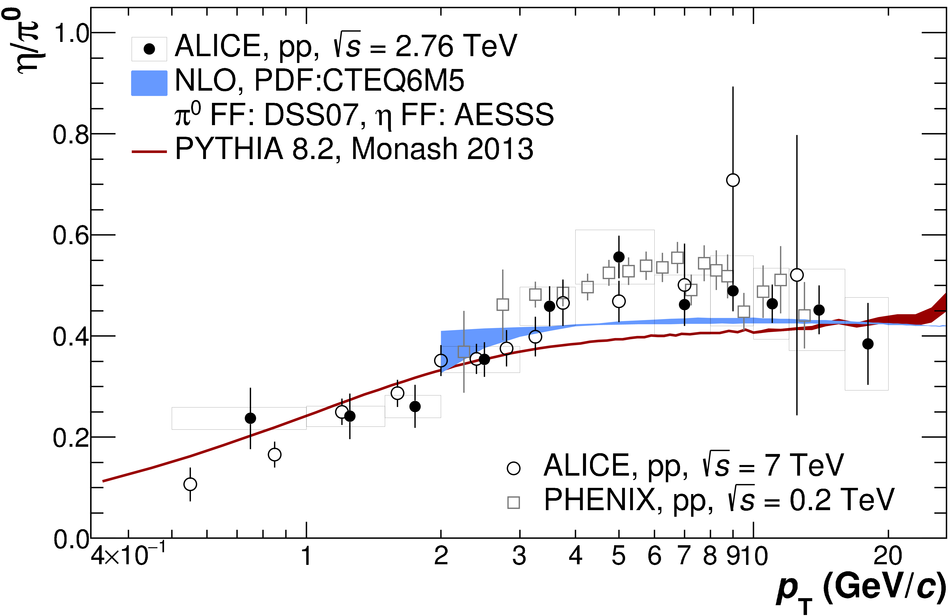 |