This letter presents the first measurement of jet mass in Pb-Pb and p-Pb collisions at $\sqrt{s_{\rm NN}}$ = 2.76 TeV and $5.02$ TeV, respectively. Both the jet energy and the jet mass are expected to be sensitive to jet quenching in the hot Quantum Chromodynamics (QCD) matter created in nuclear collisions at collider energies. Jets are reconstructed from charged particles using the anti-$k_{\rm T}$ jet algorithm and resolution parameter $R = 0.4$. The jets are measured in pseudorapidity $|\eta_{\rm{jet}}|<~0.5$ and in three intervals of transverse momentum between 60 GeV/$c$ and 120 GeV/$c$. Background from the underlying Pb-Pb event is subtracted jet-by-jet using data-driven methods. Residual background fluctuations and detector effects are corrected via a two-dimensional unfolding procedure, where the jet $p_{\rm T}$ and the mass are simultaneously corrected to particle level. The measurement of the jet mass in central Pb-Pb collisions is compared to the jet mass as measured in p-Pb reference collisions, to vacuum event generators, and to models including jet quenching.
Phys. Lett. B 776 (2018) 249
HEP Data
e-Print: arXiv:1702.00804 | PDF | inSPIRE
CERN-EP-2017-016
Figure 1
Mass response using the area-based background subtraction method in the 10\% most central \PbPb{} collisions for background fluctuations only (black histogram), compared to the full response including detector effects (red histogram), for anti-\kt{} jets with resolution parameter $R=0.4$. $M_{\rom{sub}}$ refers to the background-subtracted reconstructed jet mass while $M_{\rom{probe}}$ is the jet mass of the embedded probe. From top left to bottom right, each panel represent a $\ptjetch$ region, 40--60, 60--80, 80--100, 100--120$ \GeVc$ |  |
Figure 2
Jet mass scale characterized by the relative mean and most probable value of the response. Jet mass scale is shown as a function of probe jet \pt{} for background fluctuations and the full response including detector effects, using anti-\kt{} PYTHIA jets with $R=0.4$ embedded into central \PbPb{} collisions. Left: area-based subtraction method. Right: constituent subtraction method | 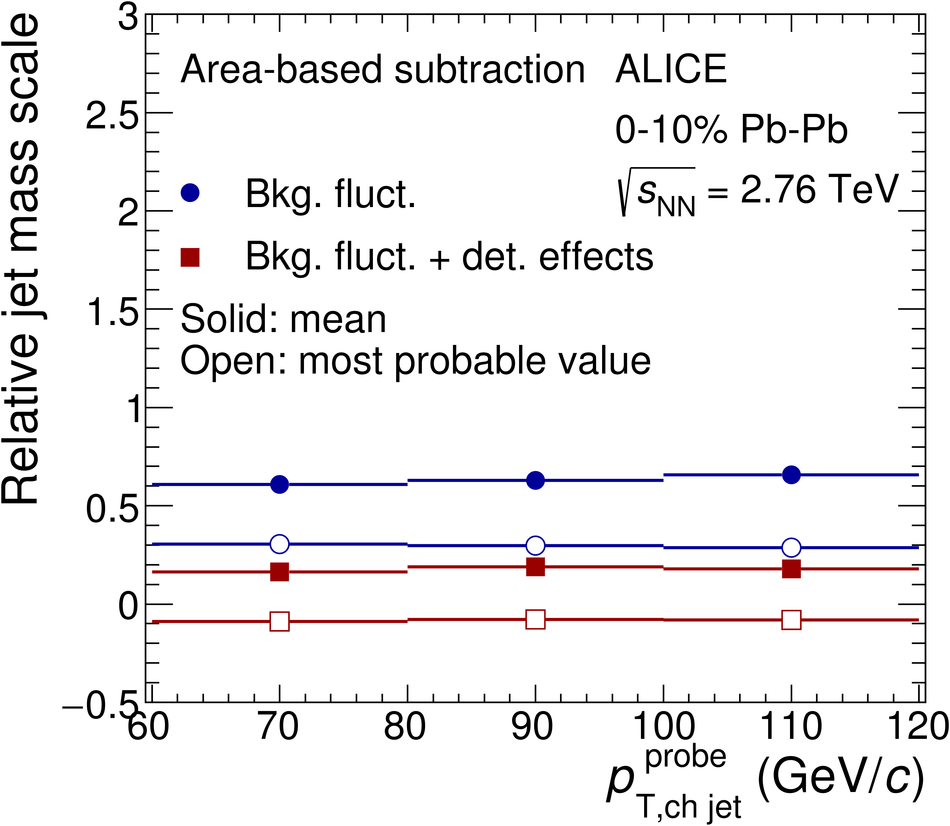 |
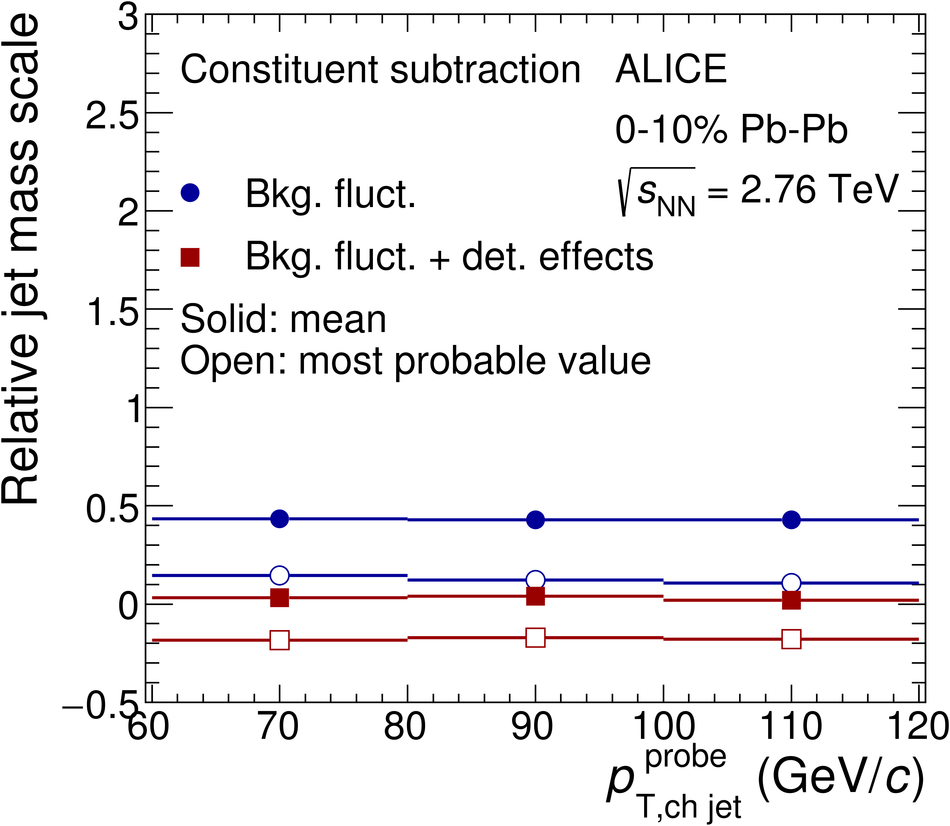
Figure 3
Jet mass resolution as a function of true jet mass $\it{M}_{\rom{ch\;jet}}^{\rom{probe}}$ for probes with $60< {\it p}_{\rom{T,ch\;jet}}^{\rom{probe}} (\GeVc)< 80$ \GeVc. \PbPb{}: Anti-\kt{} PYTHIA jets with $R=0.4$ embedded into central \PbPb{} collisions taking into account background fluctuations and detector effects. \pPb{}: 4-vectors corresponding to detector-level PYTHIA jets embedded into \pPb{} events | 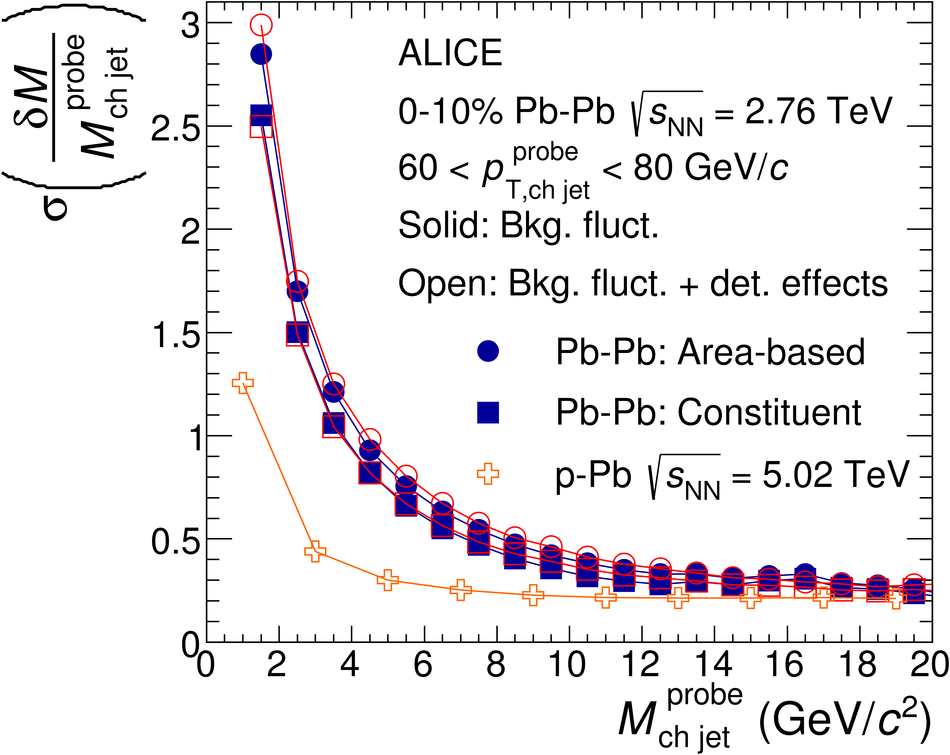 |

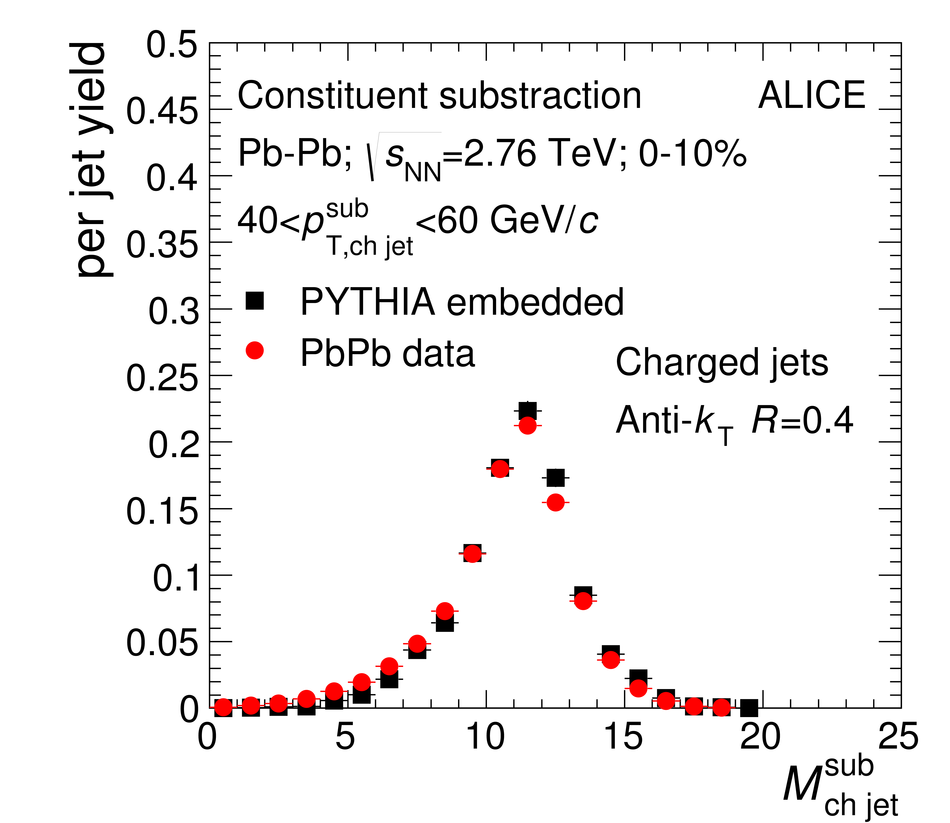


Figure 8
Ratio between fully-corrected jet mass distribution for anti-\kt{} jets with $R=0.4$ in central \PbPb{} collisions and minimum bias \pPb{} collisions. The ratio is compared to the ratio of mass distributions of PYTHIA (tune Perugia 2011) at $\sqrt{s}=2.76$ TeV and $\sqrt{s}=5.02$ TeV (width of the band represents the statistical uncertainties) | 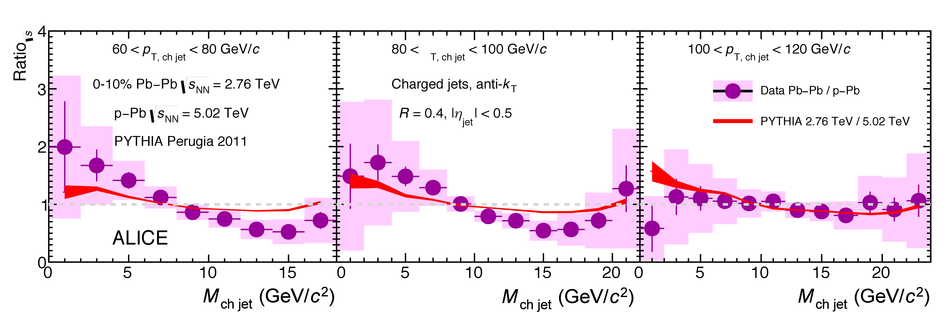 |
Figure 10
Fully-corrected jet mass distribution for anti-\kt{} jets with $R=0.4$ in the 10\% most central \PbPb{} collisions compared to PYTHIA with tune Perugia 2011 and predictions from the jet quenching event generators (JEWEL and Q-PYTHIA). Statistical uncertainties are not shown for the model calculations |  |
