The transverse momentum distributions of the strange and double-strange hyperon resonances ($\Sigma(1385)^{\pm}$, $\Xi(1530)^{0}$) produced in p-Pb collisions at $\sqrt{s_{\rm NN}}=5.02$ TeV were measured in the rapidity range $-0.5<~ y_{\rm{CMS}}<~0$ for event classes corresponding to different charged-particle multiplicity densities, $\langle{\rm d}N_{\rm{ch}}/{\rm d}\eta_{\rm{lab}}\rangle$. The mean transverse momentum values are presented as a function of $\langle{\rm d}N_{\rm{ch}}/{\rm d}\eta_{\rm{lab}}\rangle$, as well as a function of the particle masses and compared with previous results on hyperon production. The integrated yield ratios of excited to ground-state hyperons are constant as a function of $\langle{\rm d}N_{\rm{ch}}/{\rm d}\eta_{\rm{lab}}\rangle$. The equivalent ratios to pions exhibit an increase with $\langle{\rm d}N_{\rm{ch}}/{\rm d}\eta_{\rm{lab}}\rangle$, depending on their strangeness content.
Eur. Phys. J. C 77 (2017) 389
HEP Data
e-Print: arXiv:1701.07797 | PDF | inSPIRE
CERN-EP-2017-017
Figure 2
(Left) The $\Lambda\pi^{+}$ invariant mass distribution (Same-event pairs) in 2.0 $< \pt < $ 2.5 GeV/$c$ and for the multiplicity class 20-60%. The background shape,using pairs from different events (Mixed-event background),is normalised to the counts in 1.9 $< M_{\Lambda\pi}< $ 2.0 GeV/$c^2$. (Right) The invariant mass distribution after subtraction of the mixed-event background. The solid curve represents the combined fit, while the dashed line describes the residual background | 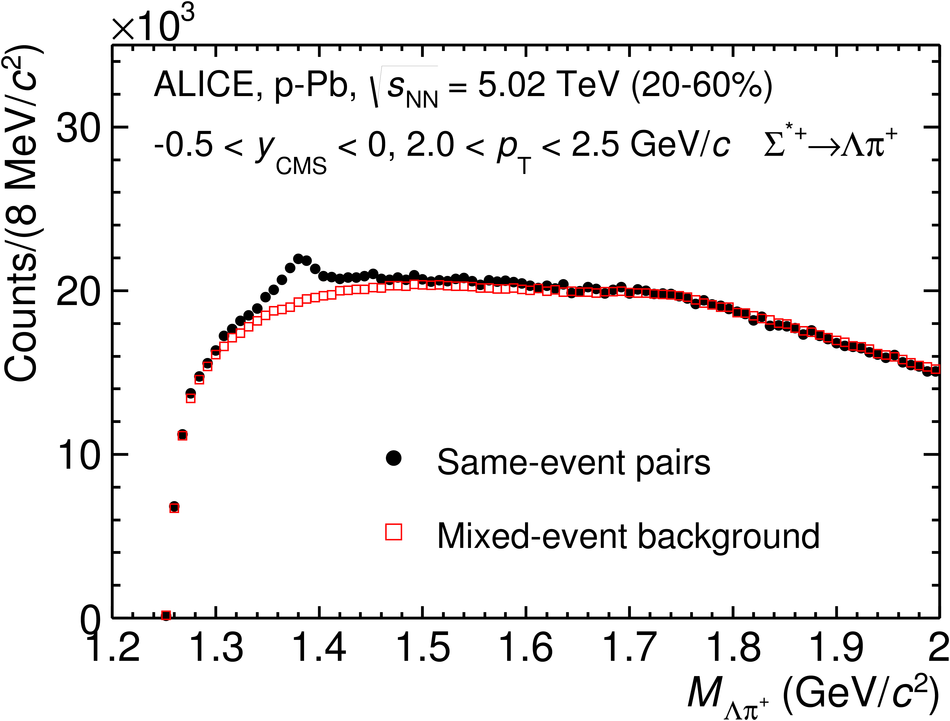 |
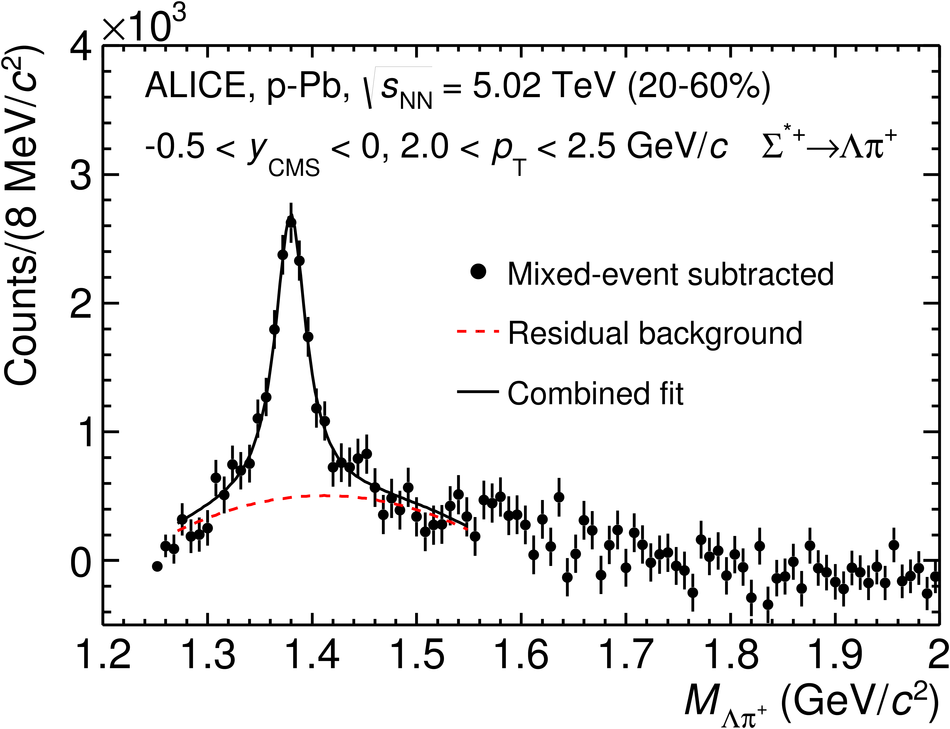
Figure 3
(Left) The $\Xi^{\mp}\pi^{\pm}$ invariant mass distribution (Same-event pairs) in 1.8 $< \pt < 2.2$ GeV/$c$ and for the multiplicity class 20-40%. The background shape, using pairs from different events (Mixed-event background), is normalised to the counts in 1.49 $< M_{\Xi\pi} < $ 1.51 GeV/$c^2$ and 1.56 $< M_{\Xi\pi} < $ 1.58 GeV/$c^2$. (Right) The invariant mass distribution after subtraction of the mixed-event background The solid curve represents the combined fit, while the dashed line describes the residual background. | 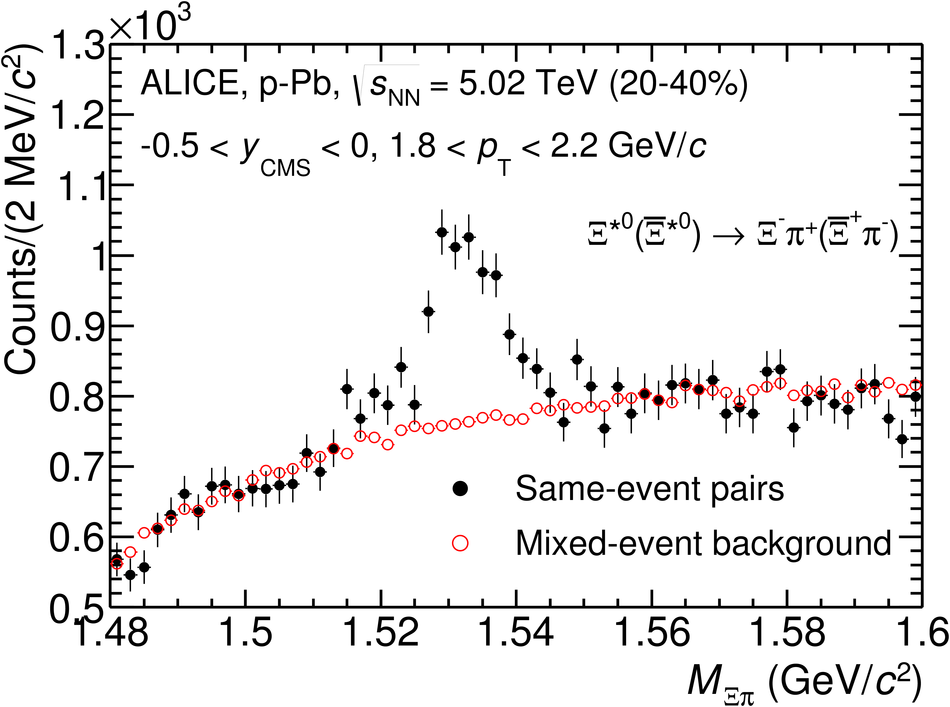 |

Figure 5
Transverse momentum spectra of $\Sigma^{*+}$ (left) and $\Xi^{*0}$ (right) in different multiplicity classes in the rapidity range $-0.5 < y_{\mathrm{CMS}} < 0$. For $\Xi^{*0}$, both particles and antiparticles are analysed together. Statistical (bars) and systematic (boxes) uncertainties are included. The dashed curves are $\rm{L\acute{e}vy-Tsallis}$ fit to each individual distribution. |  |
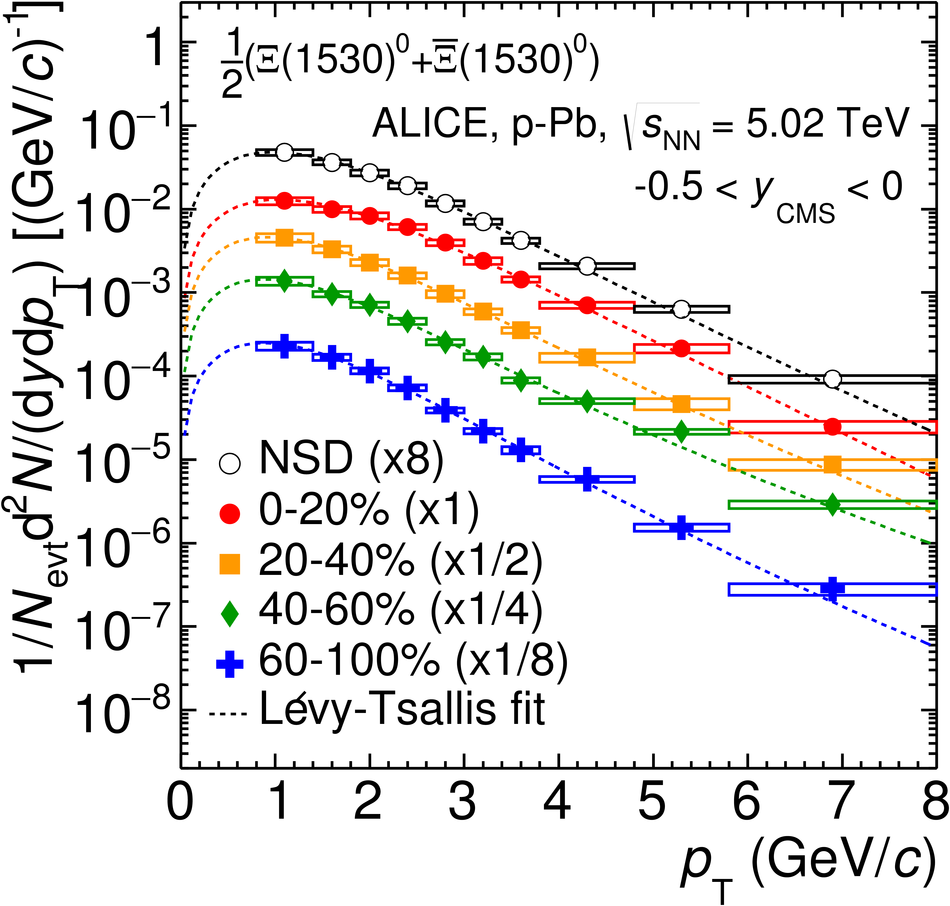
Figure 6
Mean transverse momenta $\mpt$ of $\Lambda$, $\Xi^{-}$, $\Sigma^{*\pm}$, $\Xi^{*0}$ and $\Omega^{-}$ in p-Pb collisions at $\snn$ = 5.02 TeV as a function of mean charged-particle multiplicity density $\langle$d$N_{\mathrm{ch}}$/d$\eta_{\mathrm{lab}}\rangle$, measured in the pseudorapidity range $\mid\eta_{\mathrm{lab}}\mid < $ 0.5. The results for $\Lambda$, $\Xi^{-}$ and $\Omega^{-}$ are taken from [10,14,24]. Statistical and systematic uncertainties are represented as bars and boxes, respectively. The $\Omega^-$ and $\Xi^-$ points in the 3rd and 4th lowest multiplicity bins are slightly displaced along the abscissa to avoid superposition with the $\Xi^{*0}$ points. | 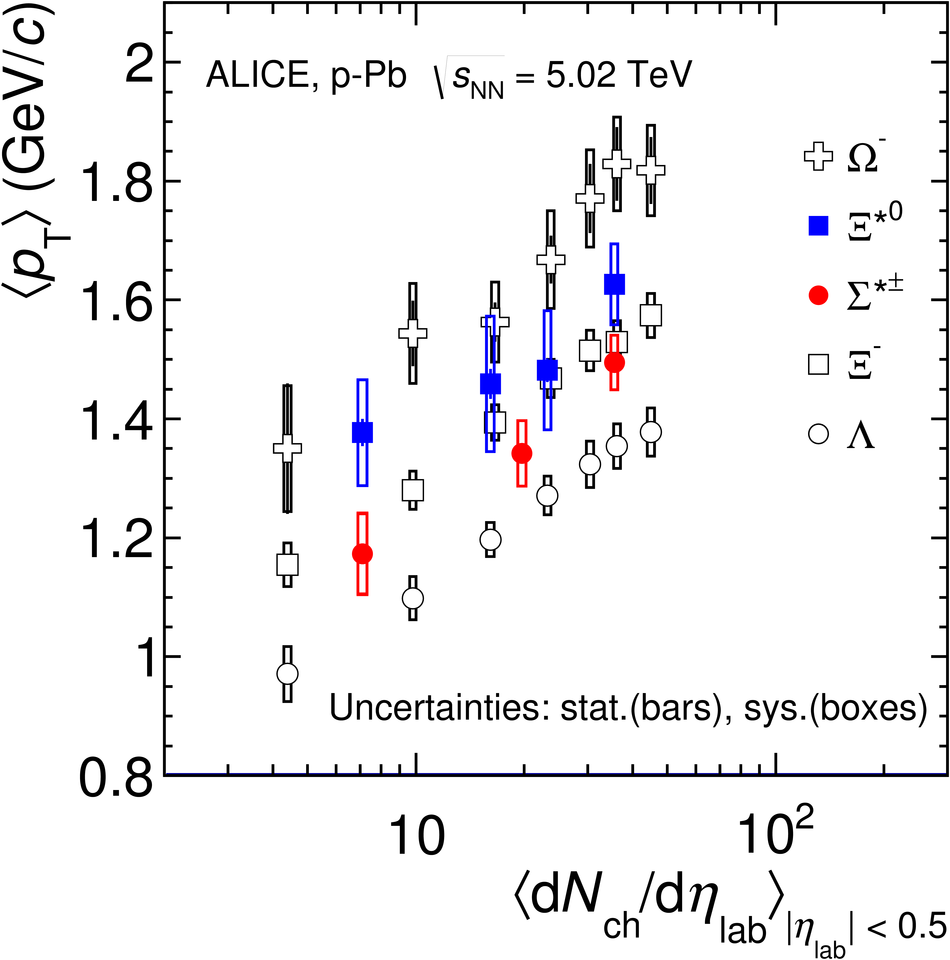 |
Figure 7
Mass dependence of the mean transverse momenta of identified particles for the $0-20$% V0A multiplicity class and with $-0.5< y_{\mathrm{CMS}}< 0$ in p-Pb collisions at $\sqrt{s_{\mathrm{NN}}}$ = 5.02 TeV [10,24], and in minimum-bias pp collisions at $\sqrt{s}$ = 7 TeV with $|y_{\mathrm{CMS}}|< 0.5$. Additionally, $D^0$ and $J$/$\psi$ results are plotted. The $D^0$ and $J$/$\psi$ were measured in different rapidity ranges: $|y_{\mathrm{CMS}}|< 0.5$ [34] ($|y_{\mathrm{CMS}}|< 0.9$ [35]) for $D^0$ ($J$/$\psi$) in pp and $-0.96 < y_{\mathrm{CMS}}< 0.04$ [34] ($-1.37< y_{\mathrm{CMS}}< 0.43$[36]) for $D^0$ ($J$/$\psi$) in p-Pb. Note also that the results for $D^0$ and $J$/$\psi$ in p-Pb collisions are for the 0-100% multiplicity class. |  |
Figure 8
(Left) Ratio of $\Sigma^{*\pm}$ to $\Lambda$ and (Right) ratio of $\Xi^{*0}$ to $\Xi^-$ measured in p-p [17,32,37,39], d-Au [32,37] and p-Pb [10,24] collisions, as a function of $\langle$d$N_{\mathrm{ch}}$/d$\eta_{\mathrm{lab}}\rangle$ measured at midrapidity. Statistical uncertainties (bars) are shown as well as total systematic uncertainties (hollow boxes) and systematic uncertainties uncorrelated across multiplicity (shaded boxes). A few model predictions are also shown as lines at their appropriate abscissa. | 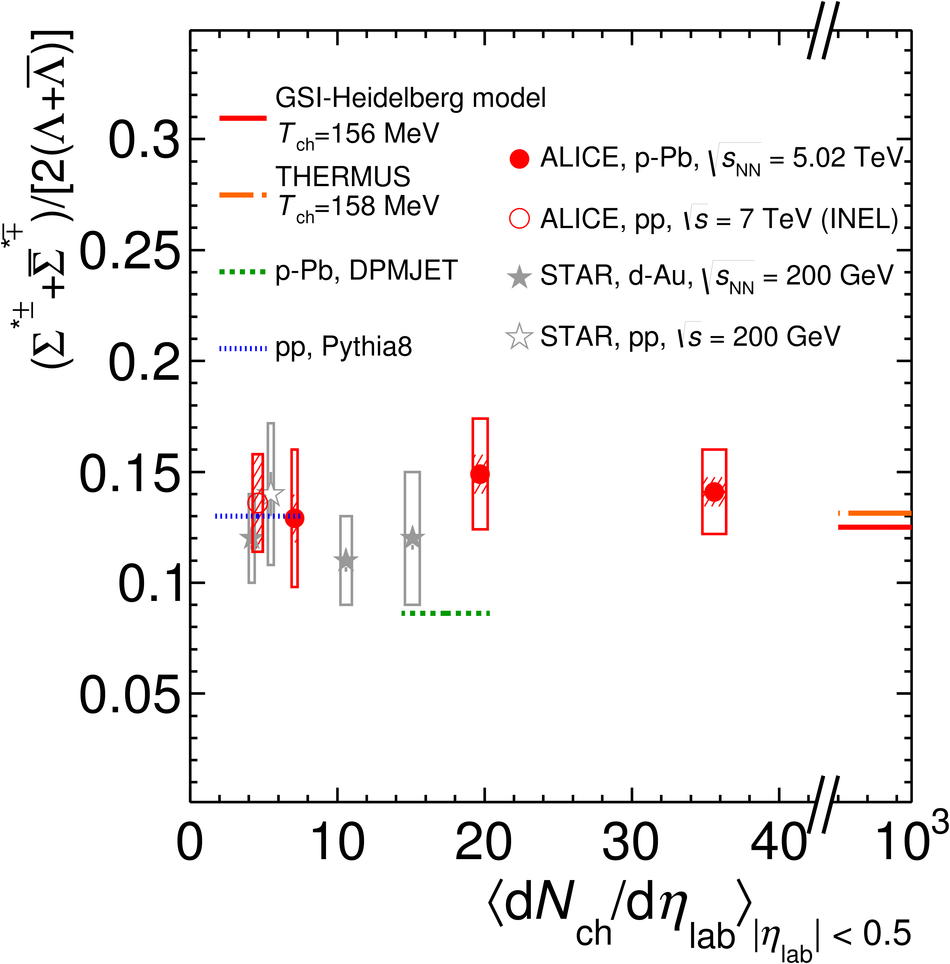 |
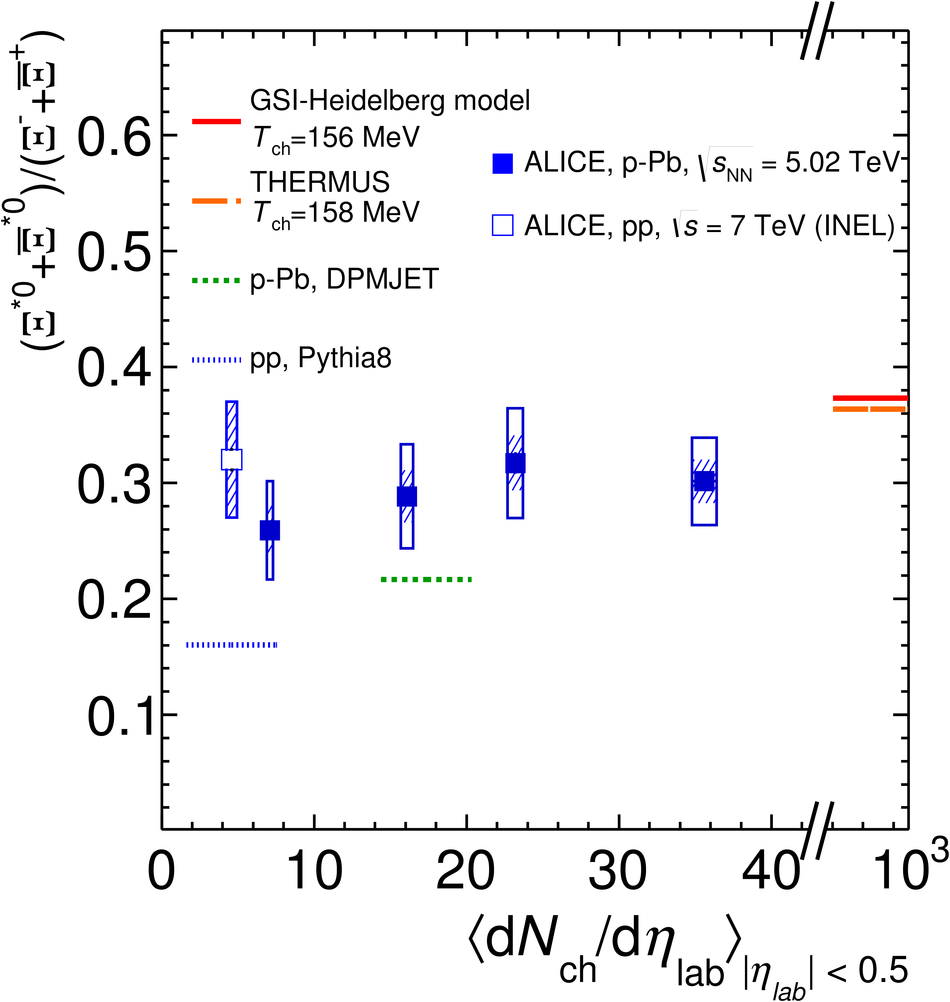
Figure 9
(Left) Ratio of $\Sigma^{*\pm}$ to $\pi^{\pm}$ and (Right) ratio of $\Xi^{*0}$ to $\pi^{\pm}$, measured in p-p [17,32,41,42], d-Au [32,37] and p-Pb [24] collisions, as a function of the average charged particle density ($\langle$d$N_{\mathrm{ch}}$/d$\eta_{\mathrm{lab}}\rangle$) measured at midrapidity. Statistical uncertainties (bars) are shown as well as total systematic uncertainties (hollow boxes) and systematic uncertainties uncorrelated across multiplicity (shaded boxes). A few model predictions are also shown as lines at their appropriate abscissa. | 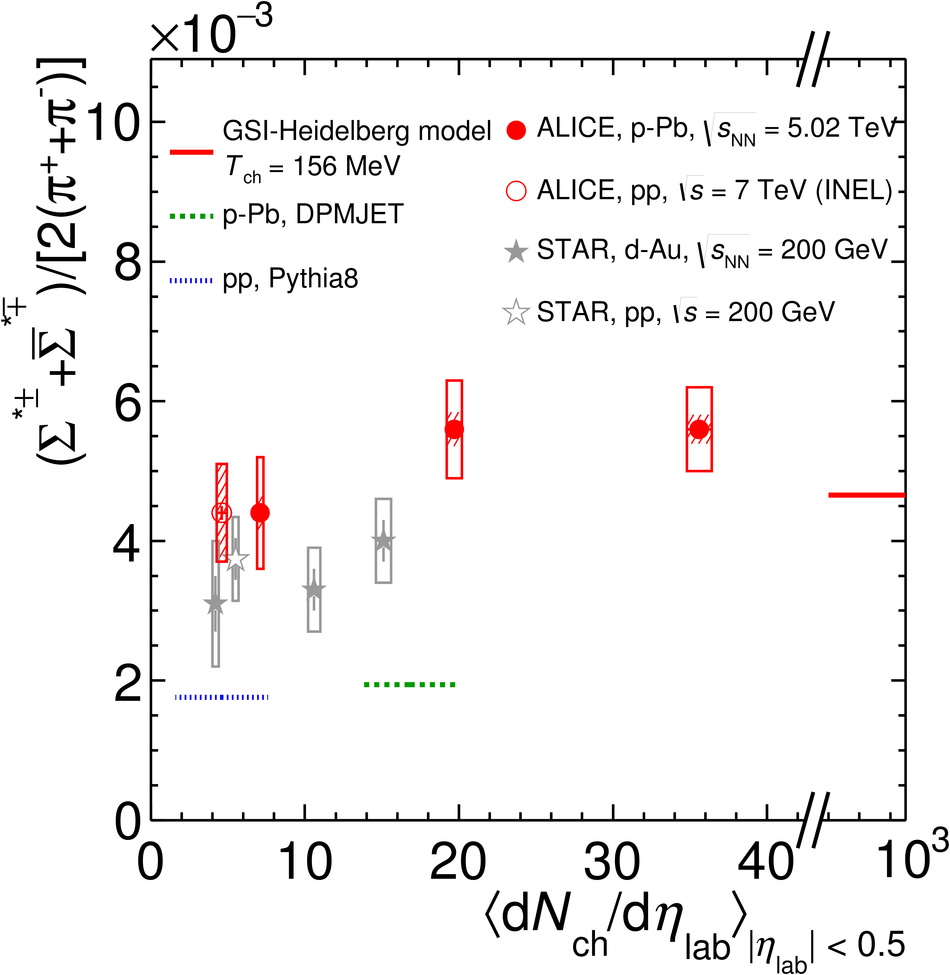 |
