We present results on transverse momentum ($p_{\rm T}$) and rapidity ($y$) differential production cross sections, mean transverse momentum and mean transverse momentum square of inclusive J/$\psi$ and $\psi(2S)$ at forward rapidity ($2.5<~y<~4$) as well as $\psi(2S)$-to-J/$\psi$ cross section ratios. These quantities are measured in pp collisions at center of mass energies $\sqrt{s}=5.02$ and 13 TeV with the ALICE detector. Both charmonium states are reconstructed in the dimuon decay channel, using the muon spectrometer. A comprehensive comparison to inclusive charmonium cross sections measured at $\sqrt{s}=2.76$, 7 and 8 TeV is performed. A comparison to non-relativistic quantum chromodynamics and fixed-order next-to-leading logarithm calculations, which describe prompt and non-prompt charmonium production respectively, is also presented. A good description of the data is obtained over the full $p_{\rm T}$ range, provided that both contributions are summed. In particular, it is found that for $p_{\rm T}>15$ GeV/$c$ the non-prompt contribution reaches up to 50% of the total charmonium yield.
Eur. Phys. J. C 77 (2017) 392
HEP Data
e-Print: arXiv:1702.00557 | PDF | inSPIRE
CERN-EP-2017-015
Figure 1
Example of fit to the opposite-sign dimuon invariant mass distributions in pp collisions at $\sqrts=13$ TeV (left) and $5.02$ TeV (right). Dashed lines correspond to either signal or background functions, whereas the solid line corresponds to the sum of the signal and background functions. | 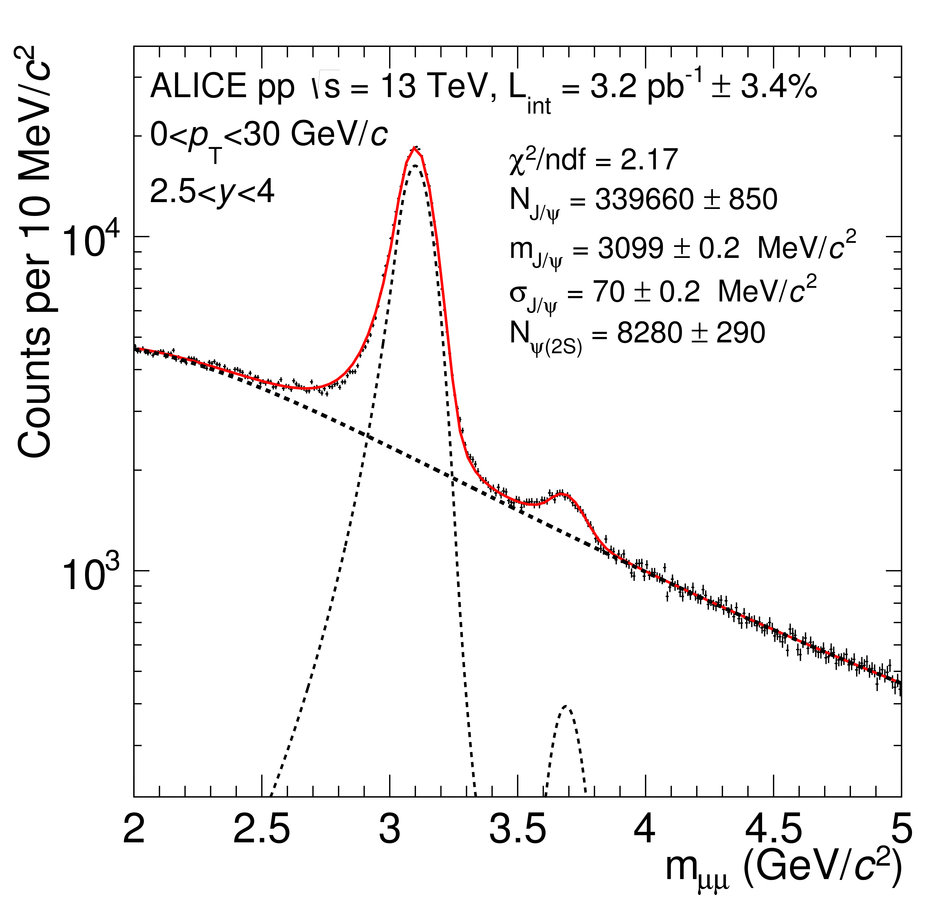 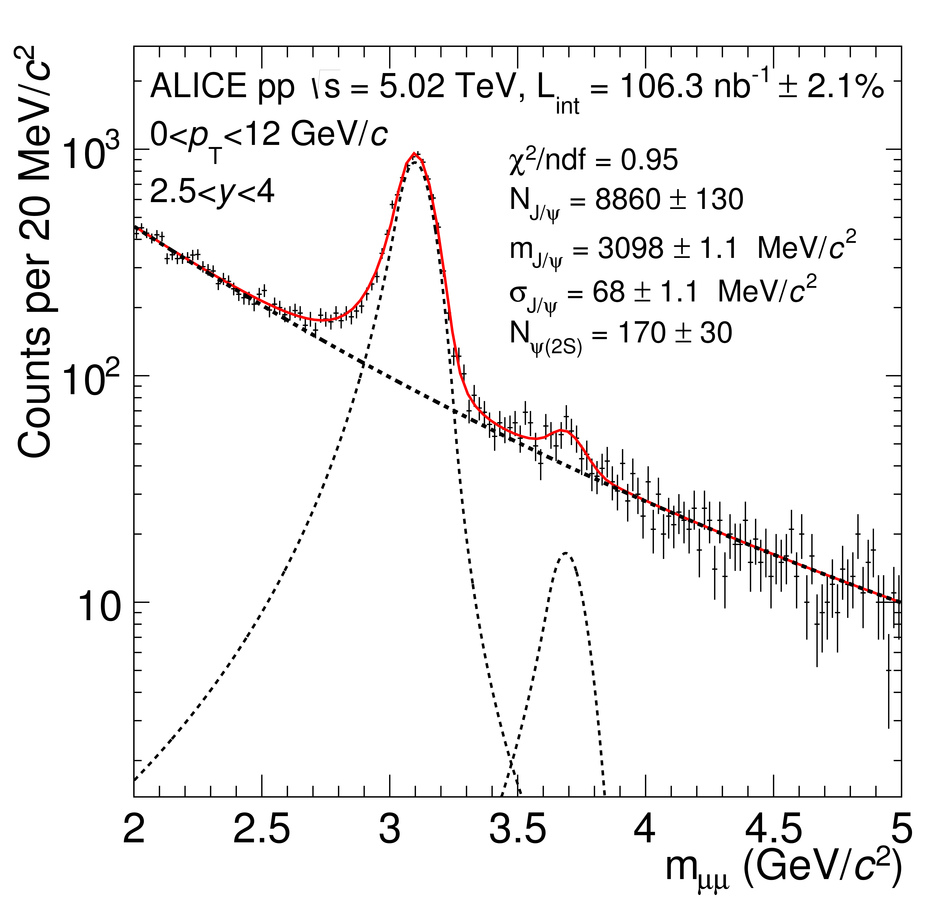 |
Figure 2
Inclusive $\jpsi$ cross sections (top), $\psi(2S)$ cross sections (middle) and $\psi(2S)$-to-$\jpsi$ cross section ratios (bottom) as a function of $\pt$ (left) and $y$ (right) in pp collisions at $\sqrts=13$ TeV. $\jpsi$ cross sections are compared to LHCb measurements at the same $\sqrts$ [11]. Open symbols are the reflection of the positive-$y$ measurements with respect to $y=0$. |  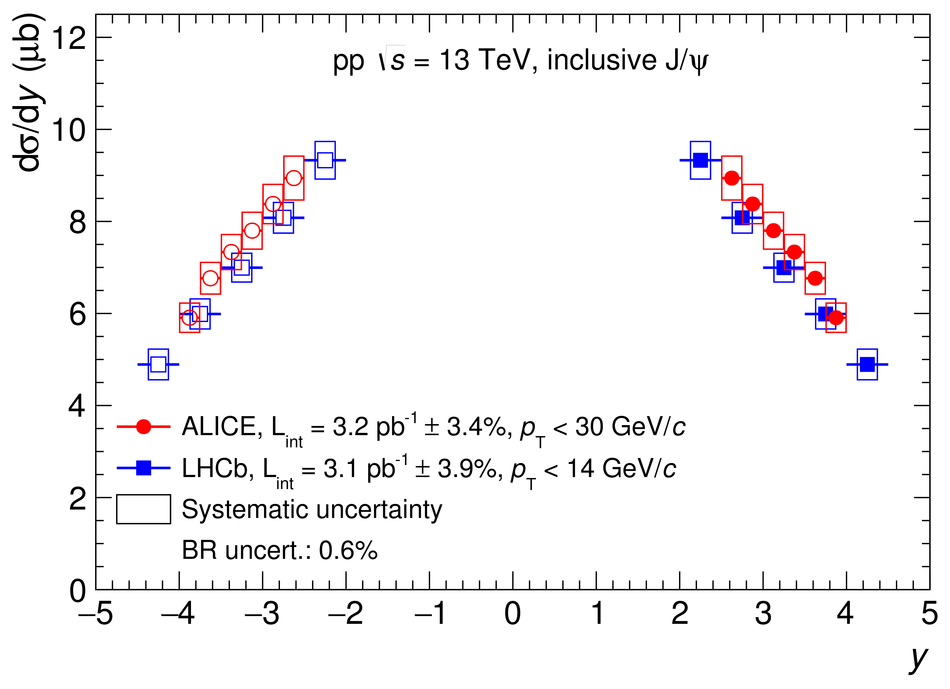 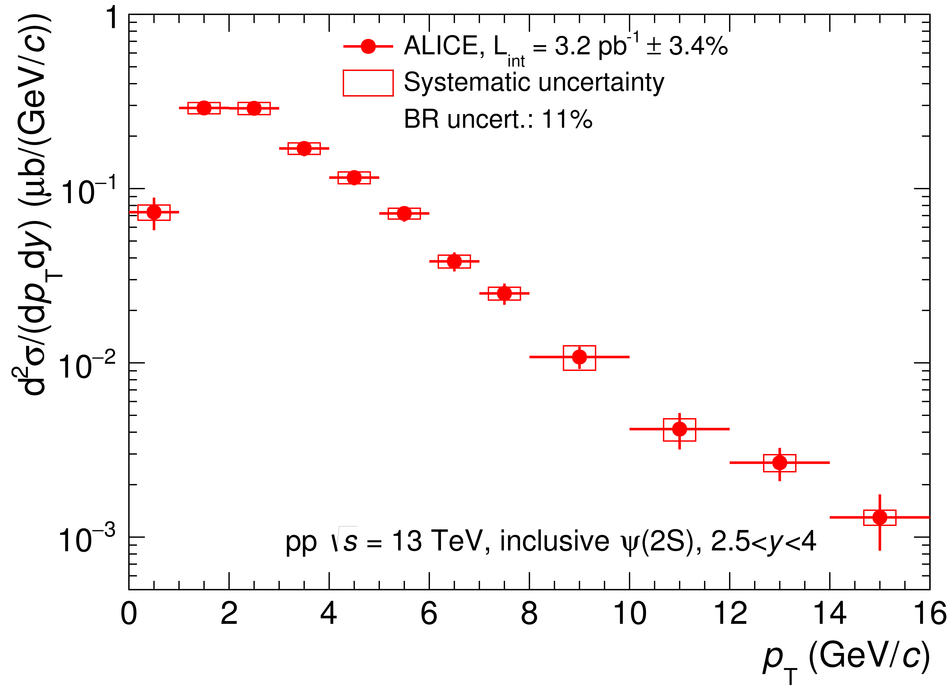 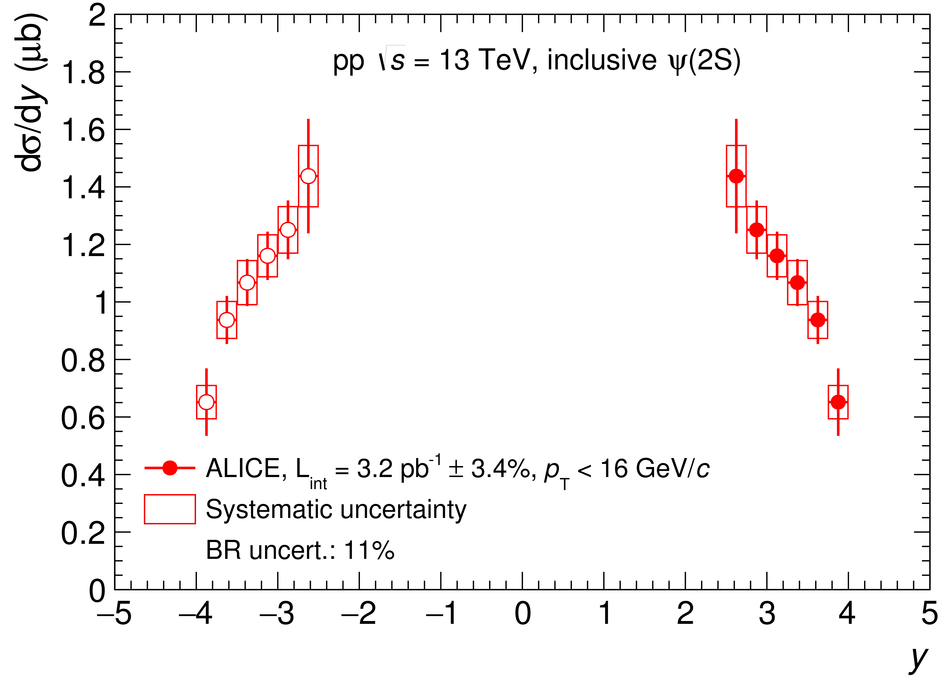 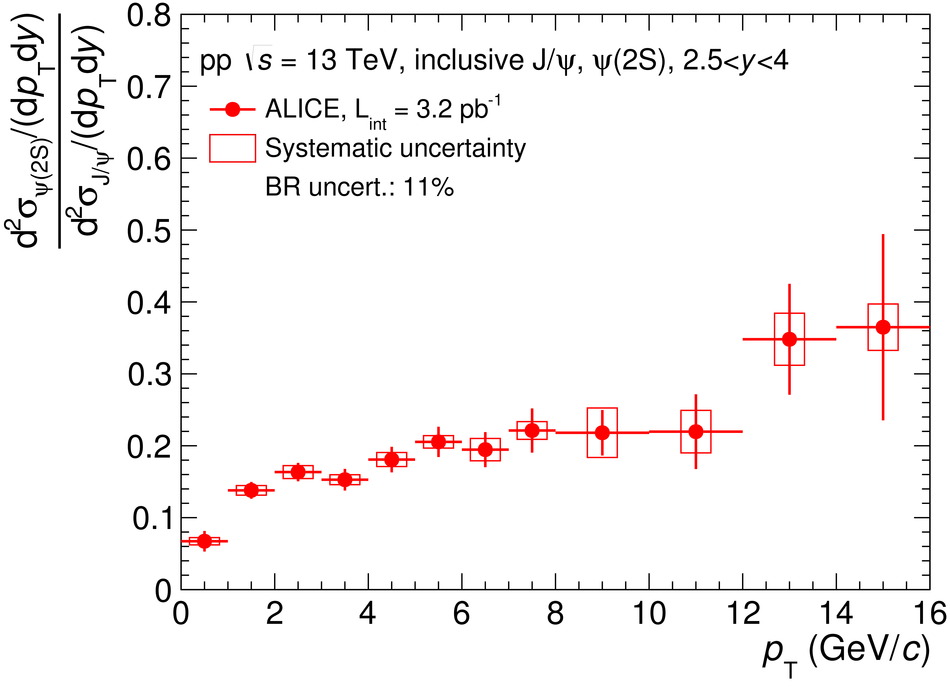 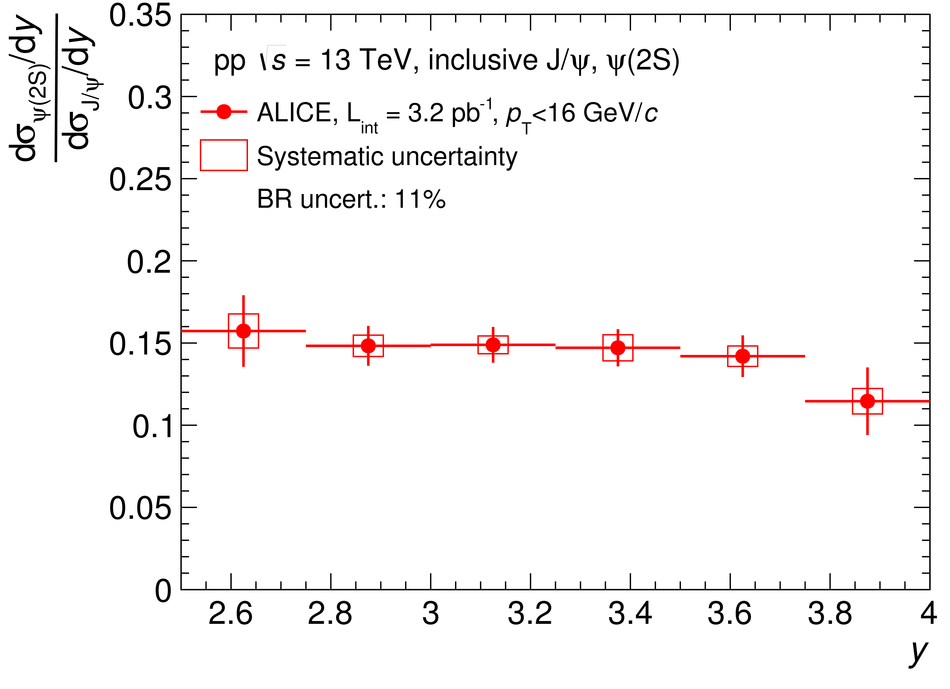 |

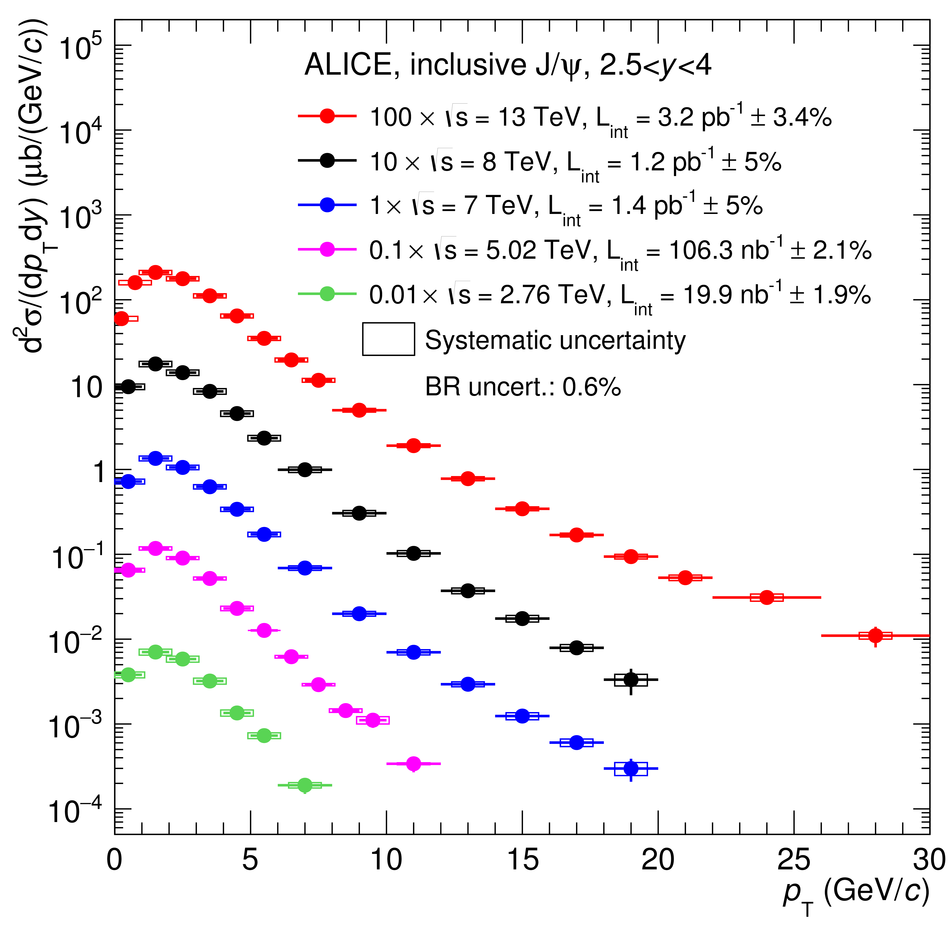

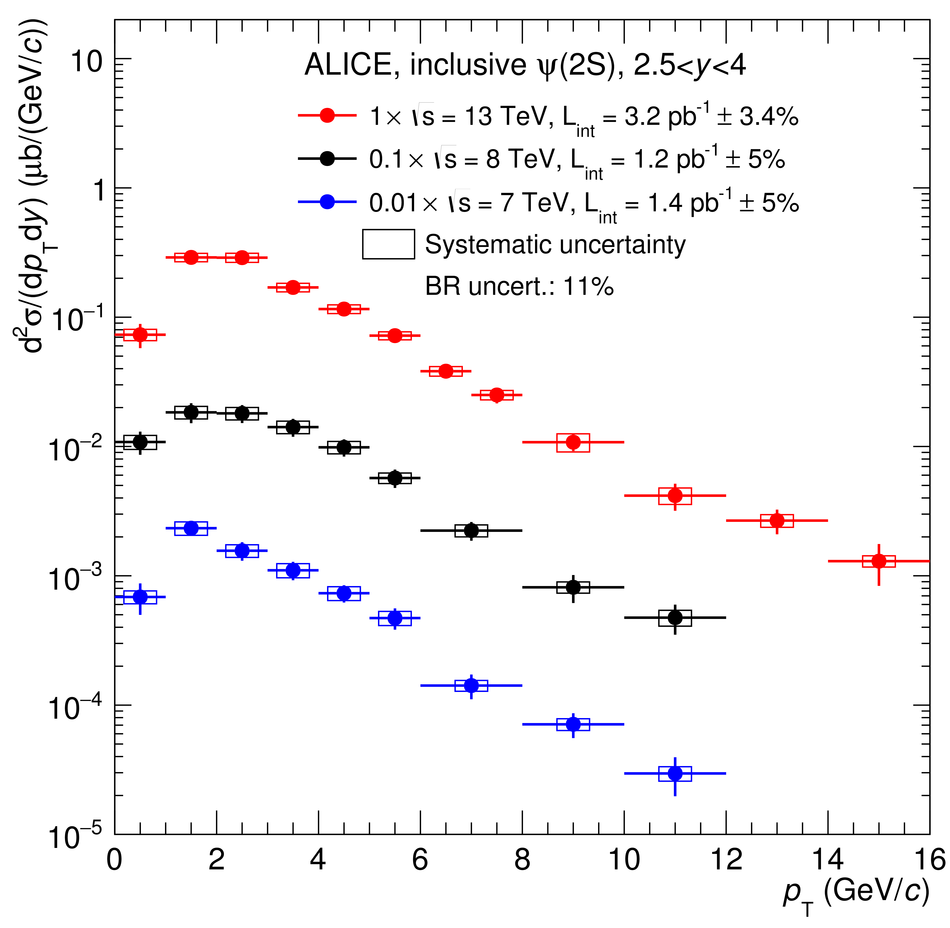

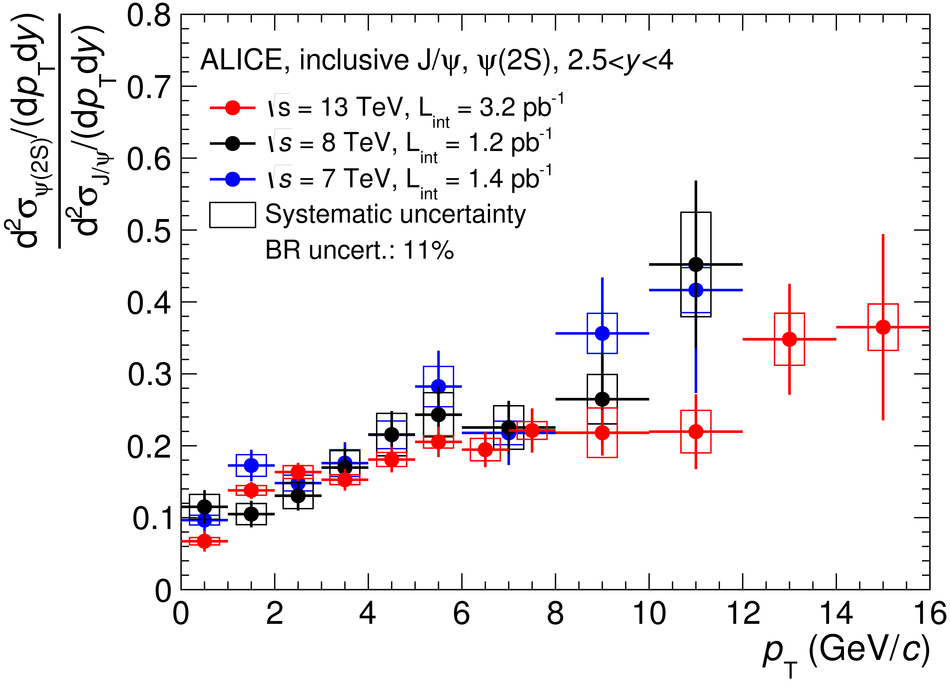
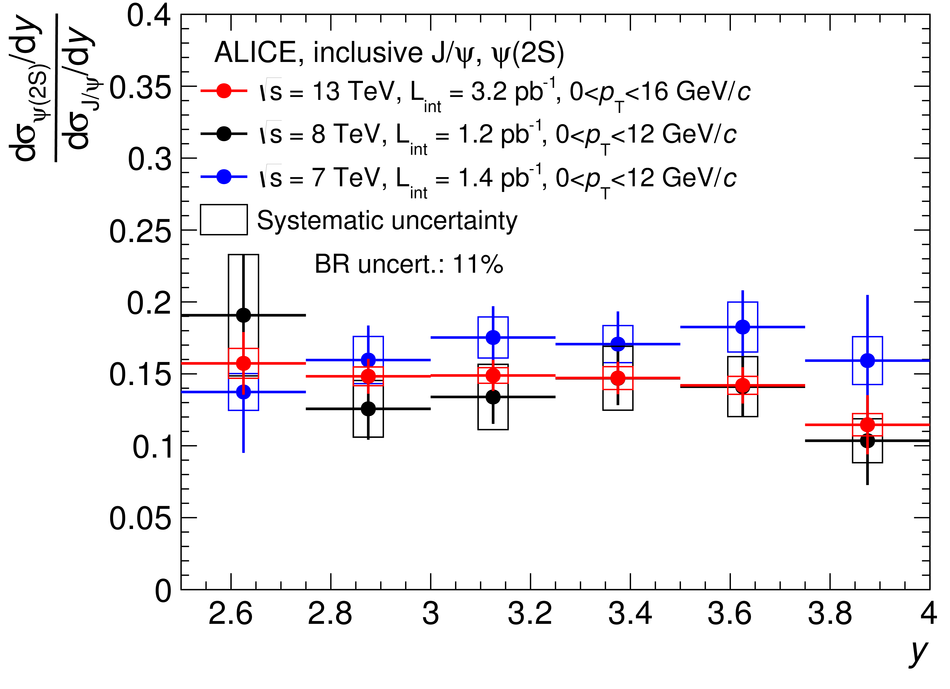
Figure 5
$\langle\pt\rangle$ (left) and $\langle\pt^2\rangle$ (right) as a function of $\sqrts$ for $\jpsi$ (top) and $\psi(2S)$ (bottom). Circles correspond to ALICE data, while the other symbols correspond to measurements at lower $\sqrts$ Vertical lines around the data points correspond to the quadratic sum of the statistical and uncorrelated systematic uncertainties. The solid lines correspond to calculating $\langle\pt\rangle$ and $\langle\pt^2\rangle$ when extrapolating the $\pt$ coverage to the largest available range in ALICE data ($0< \pt< 30$ GeV/$c$ for $\jpsi$ and $0< \pt< 16$ GeV/$c$ for $\psi(2S)$), while the dashed lines correspond to truncating the data to the smallest $\pt$ range available ($0< \pt< 8$ GeV/$c$ for $\jpsi$ and $0< \pt< 12$ GeV/$c$ for $\psi(2S)$). | 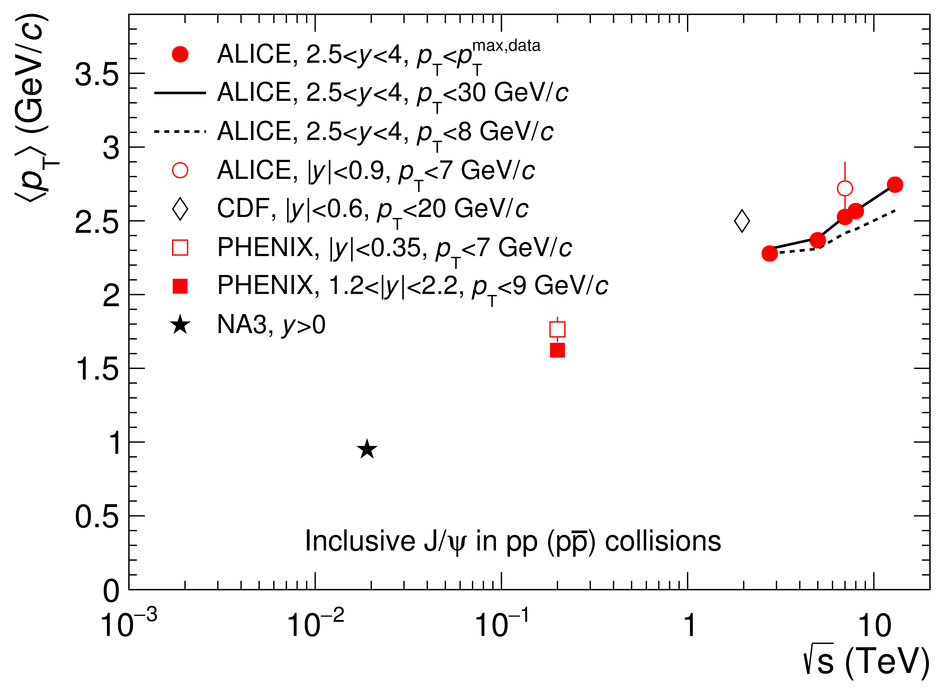 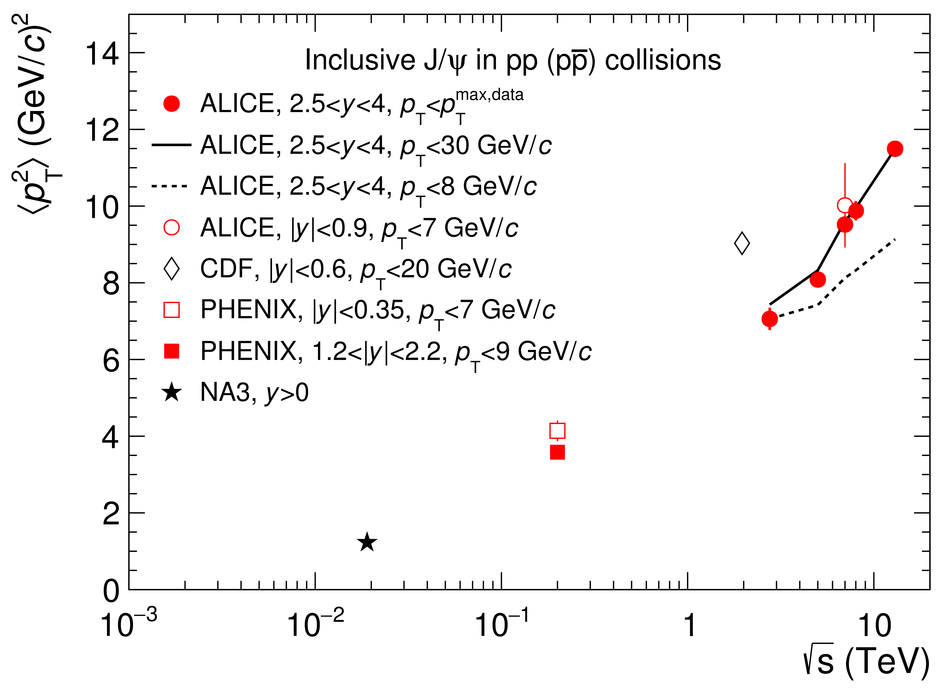   |
Figure 6
$\jpsi$ (left) and $\psi(2S)$ (right) inclusive cross section $\rm d\sigma/\rm d y$ as a function of $\sqrts$. Vertical lines correspond to the quadratic sum of the statistical and uncorrelated systematic uncertainties. $\jpsi$ cross sections are compared to a CEM calculation from [34]. | 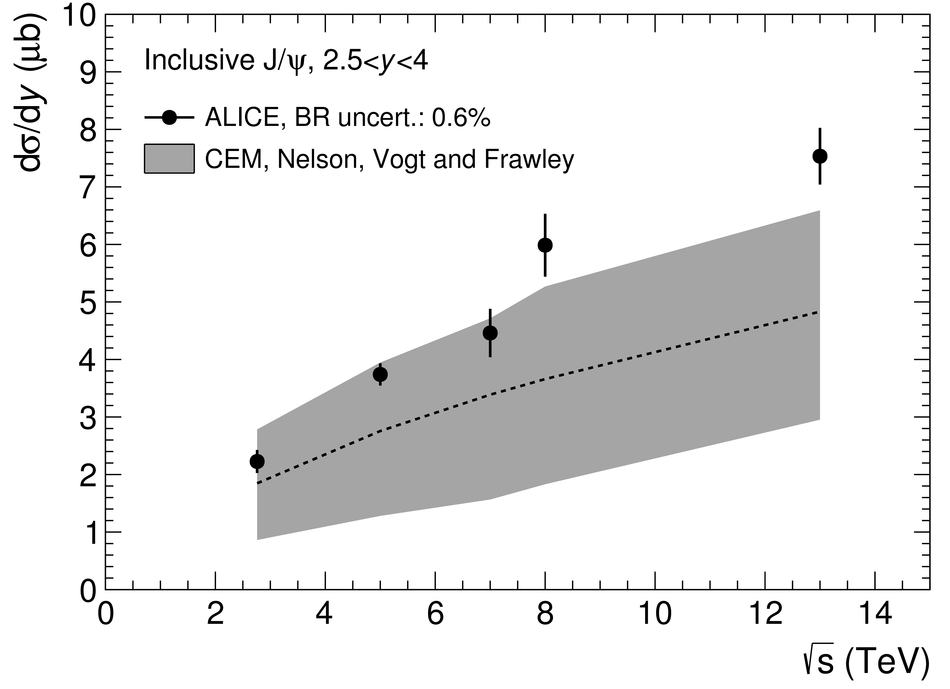 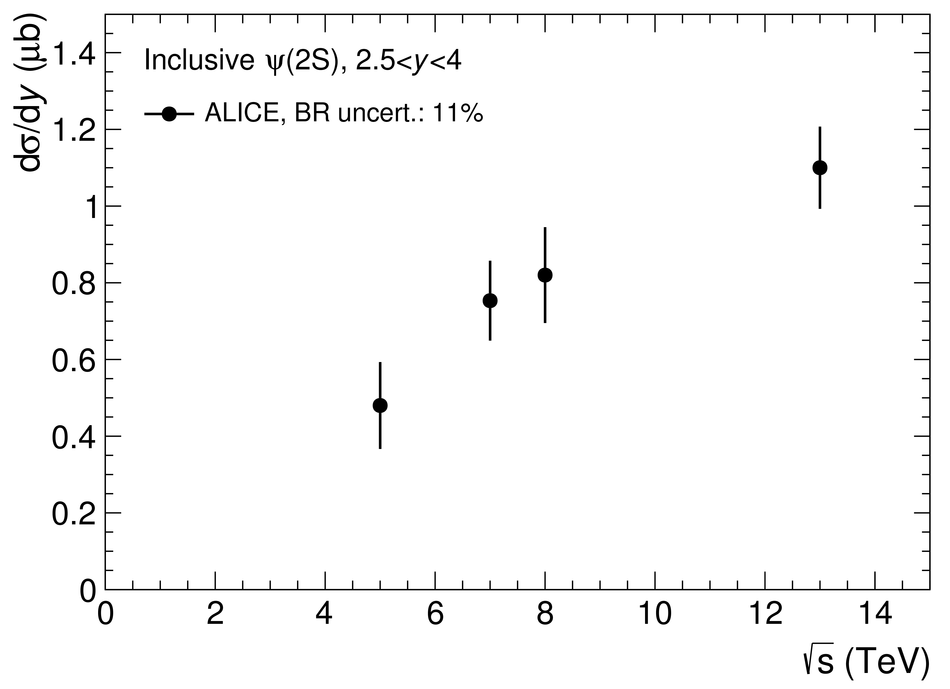 |
Figure 7
Left panel: $\jpsi$ differential cross sections (red circles) in pp collisions at $\sqrts=13$ TeV compared to NLO NRQCD (grey) [35], LO NRQCD coupled with CGC (blue) [36] and FONLL (red) [37]. Right panel: the non-prompt $\jpsi$ contribution estimated with FONLL is summed to the two calculations for prompt $\jpsi$ production and compared to the same data. | 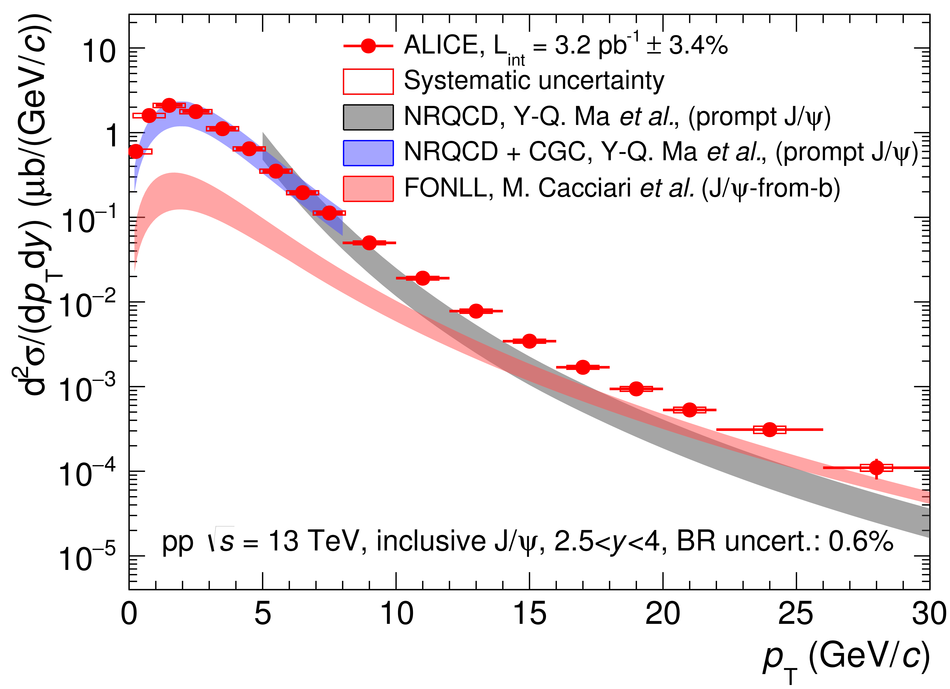 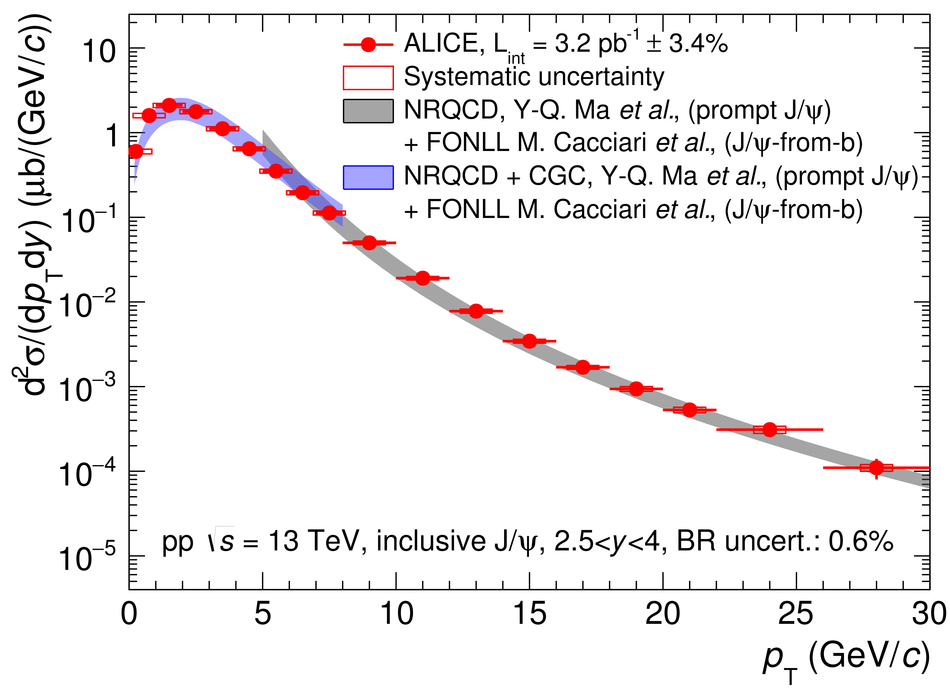 |
Figure 8
Comparisons between ALICE $\jpsi$ and $\psi(2S)$ data and summed NRQCD and FONLL model calculations from [35], [36] and [37]. The first five panels correspond to inclusive $\jpsi$ production cross sections as a function of $\pt$ in pp collisions at $\sqrts=13$, $8$, $7$, $5.02$ and $2.76$ TeV (red), the next three panels to inclusive $\psi(2S)$ cross sections as a function of $\pt$ at $\sqrts=13$, $8$ and $7$ TeV (blue) and the last three panels to $\psi(2S)$-to-$\jpsi$ cross section ratios as a function of $\pt$ at the same $\sqrts$ (black). | 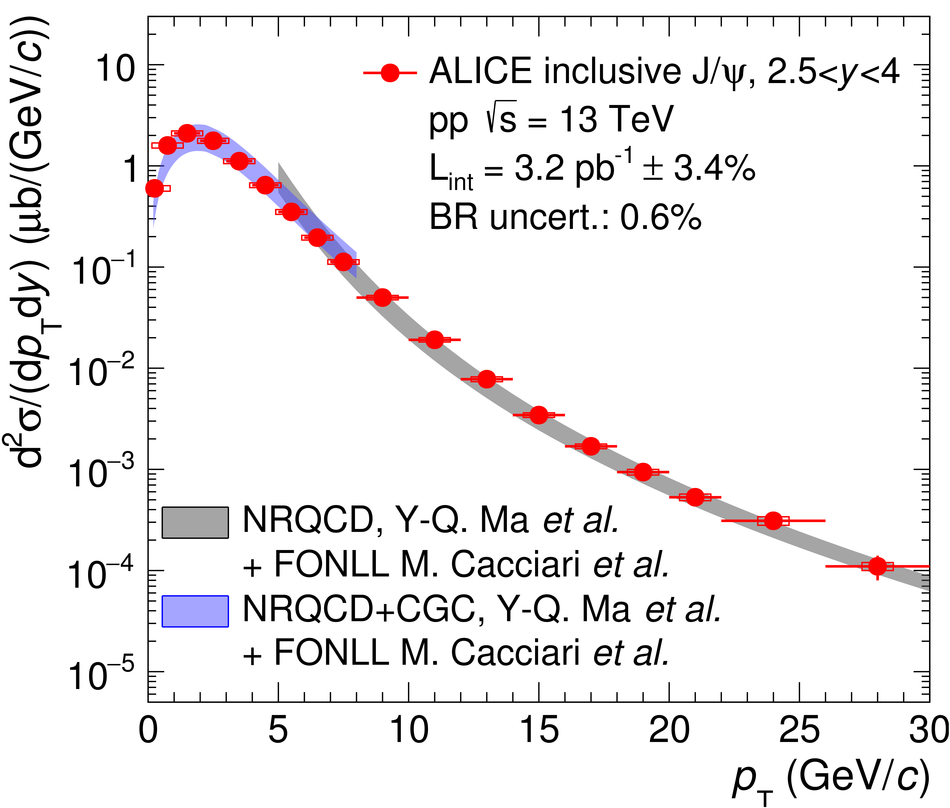 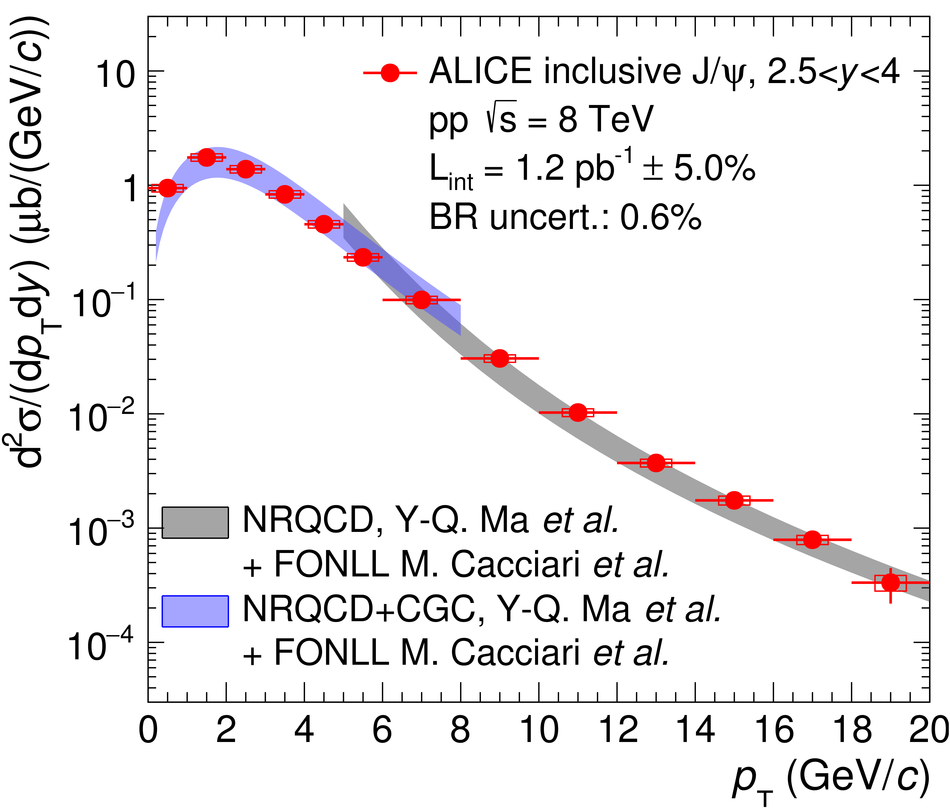 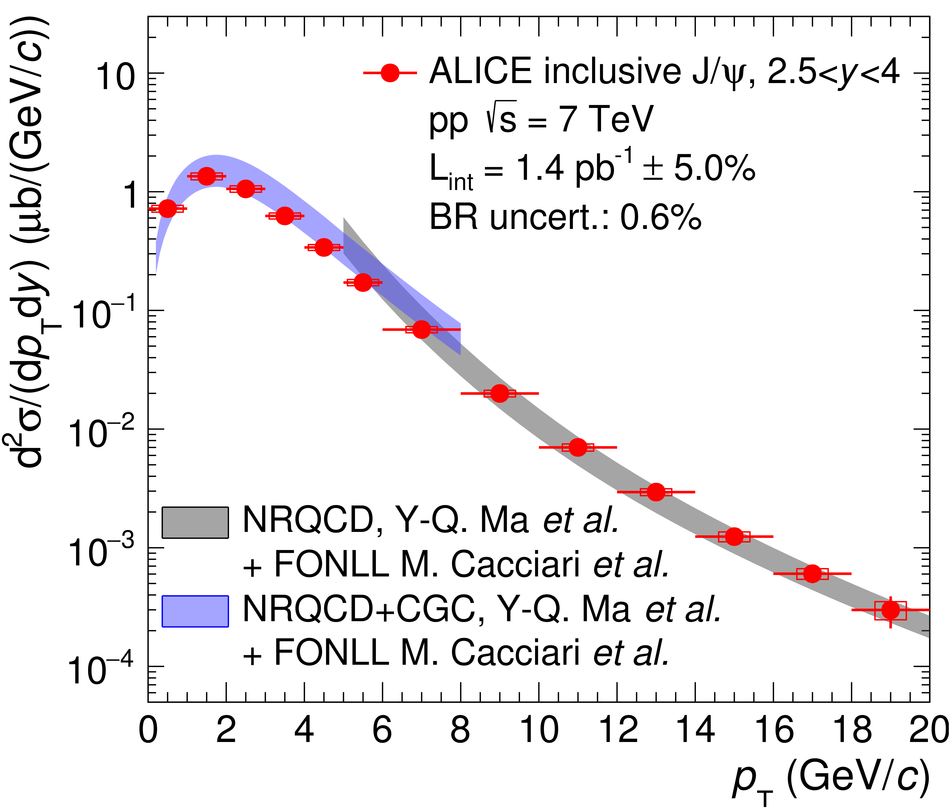 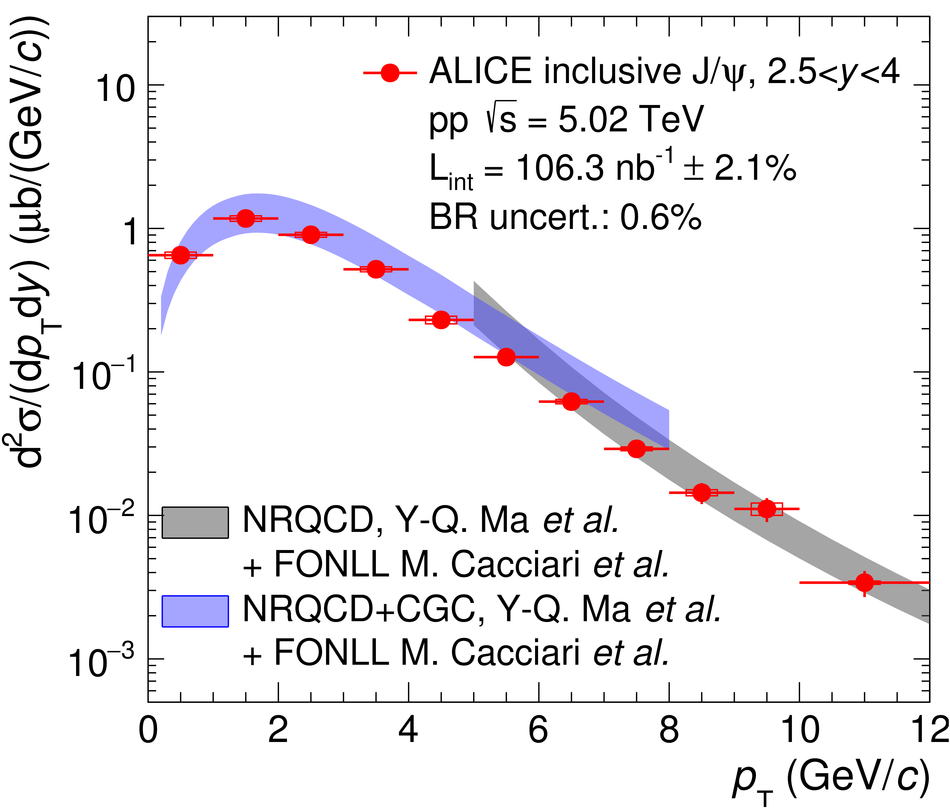 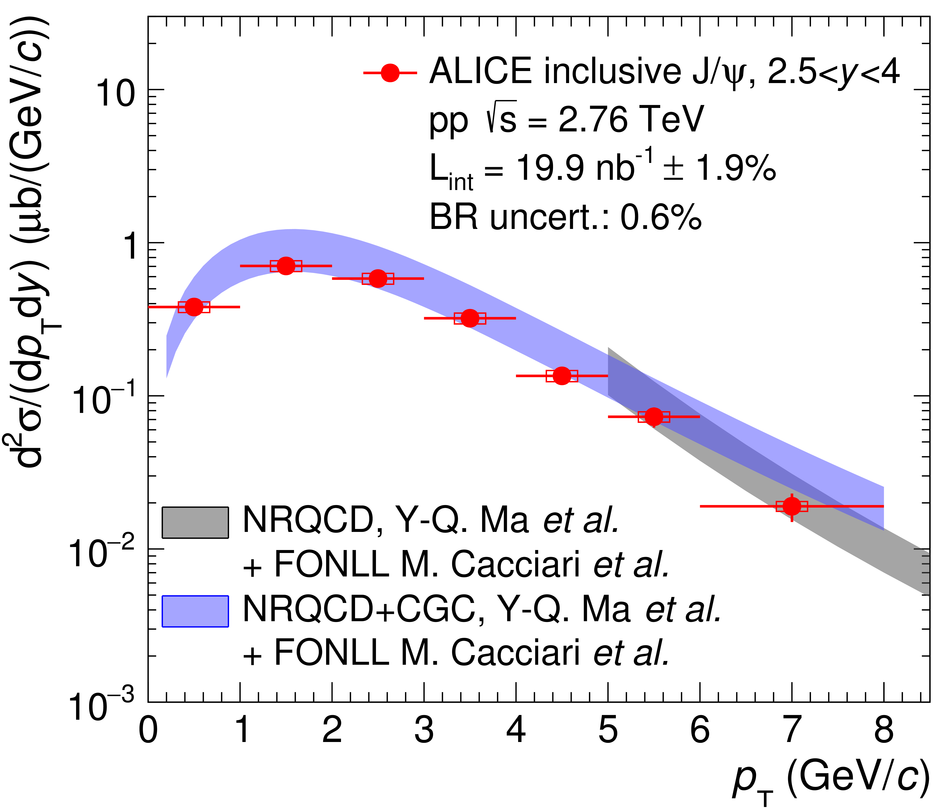 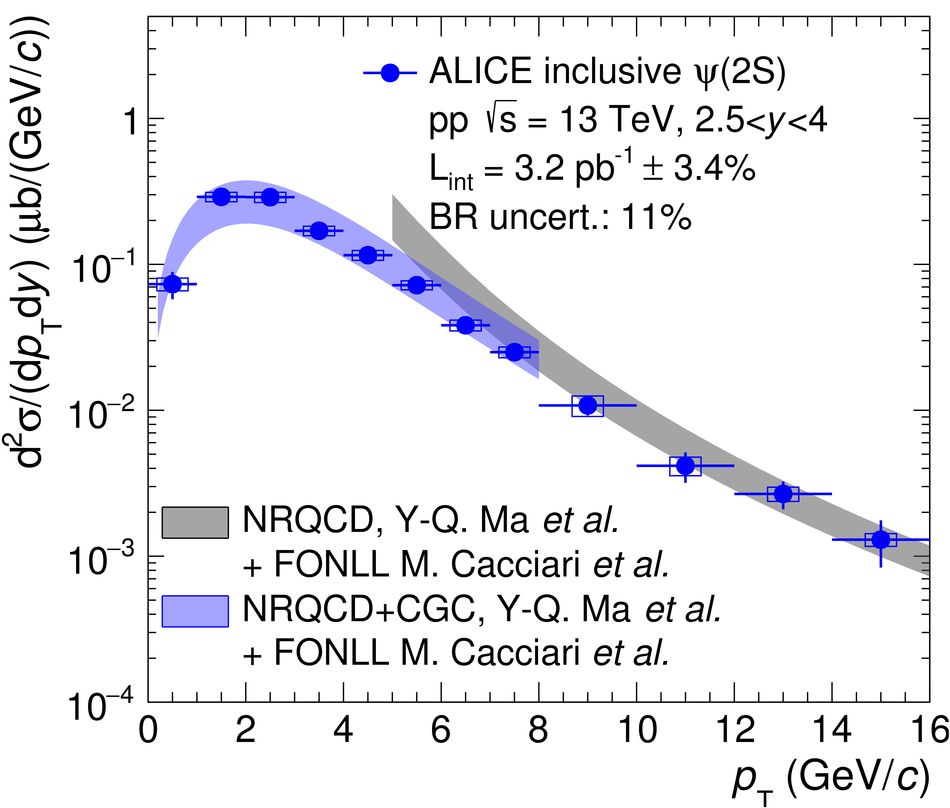  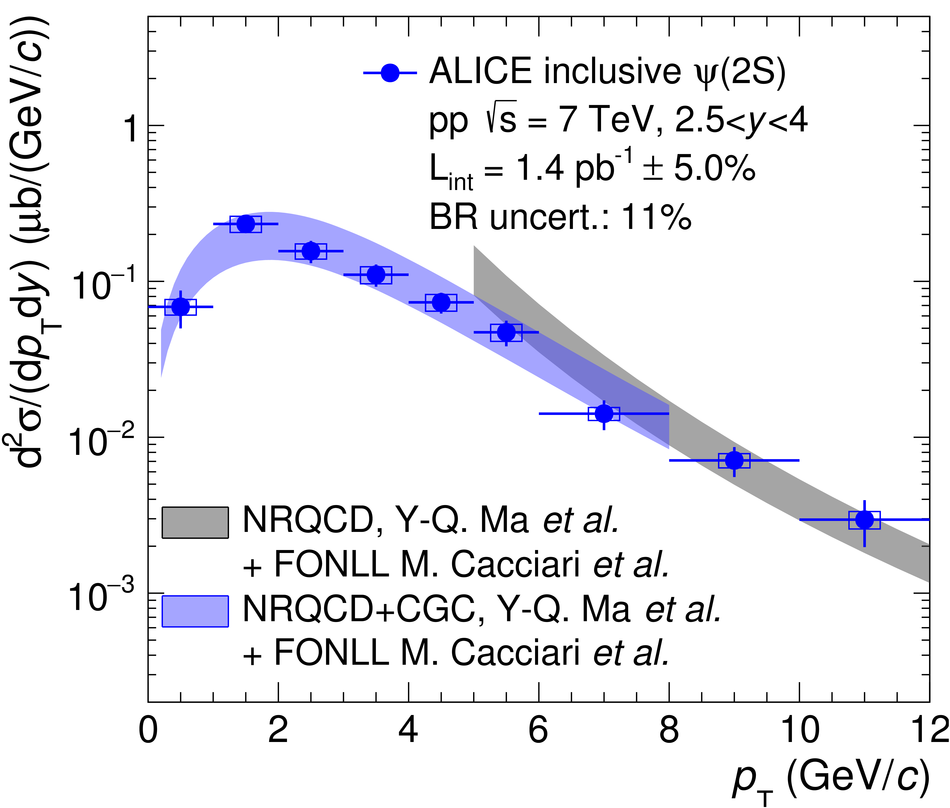  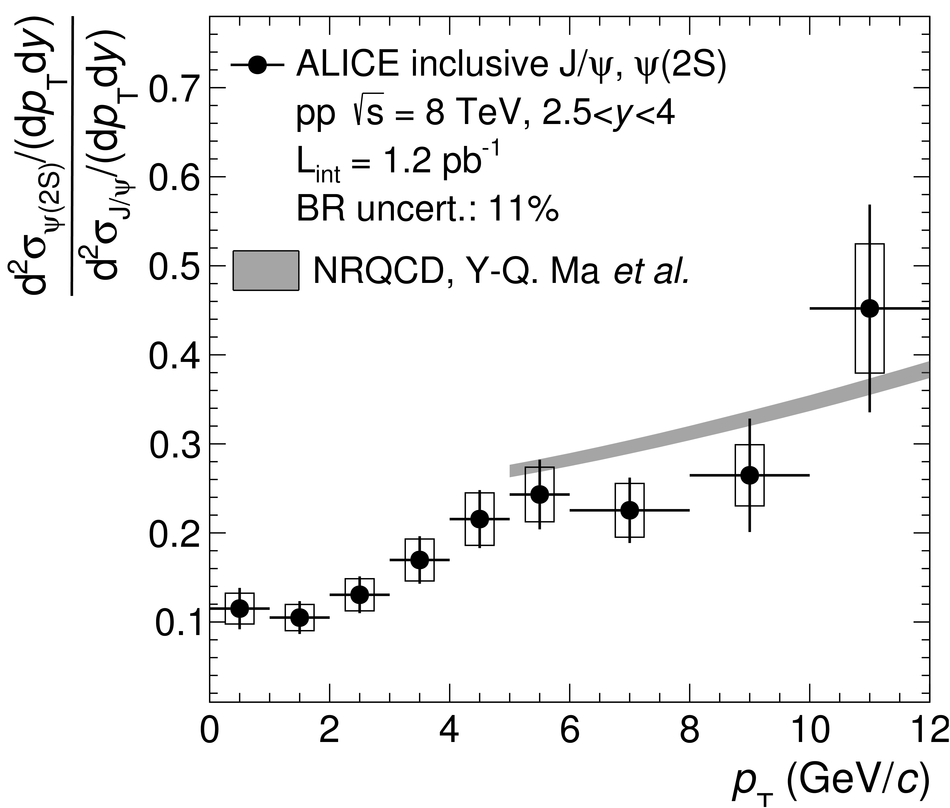 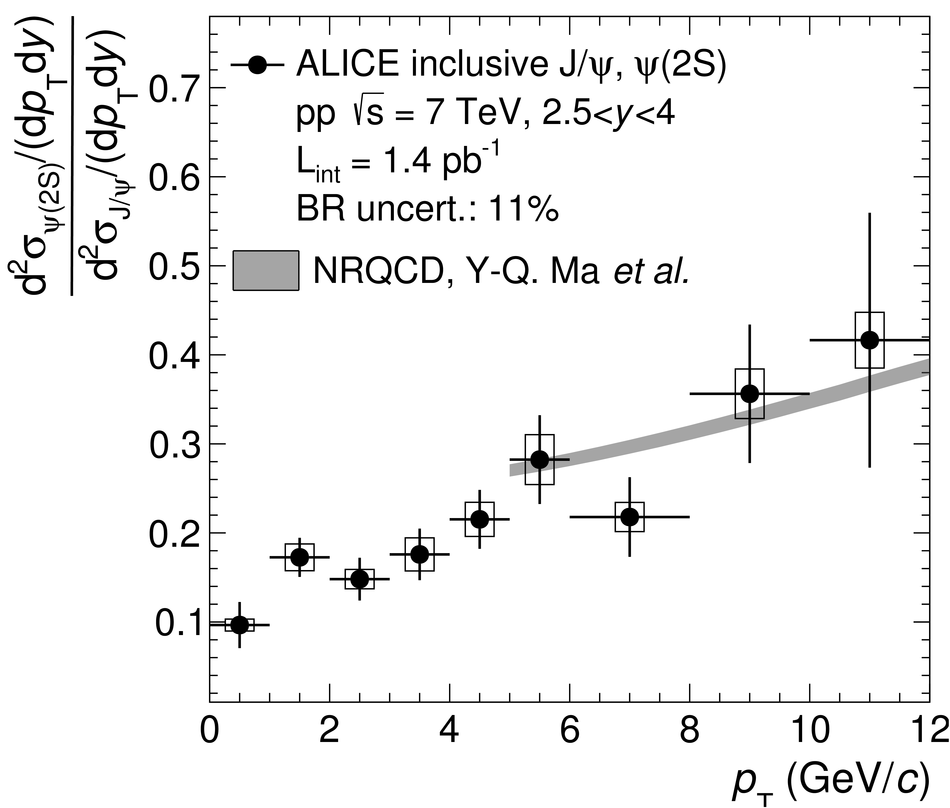 |
Figure 9
Comparisons between ALICE $\jpsi$ and $\psi(2S)$ data and summed NRQCD and FONLL model calculations from [36] and [37]. The first five panels correspond to inclusive $\jpsi$ production cross sections as a function of $y$ in pp collisions at $\sqrts=13$, $8$ and $7$, $5.02$ and $2.76$ TeV (red), while the next three panels to inclusive $\psi(2S)$ cross sections as a function of $y$ at $\sqrts=13$, $8$ and $7$ TeV (blue). |  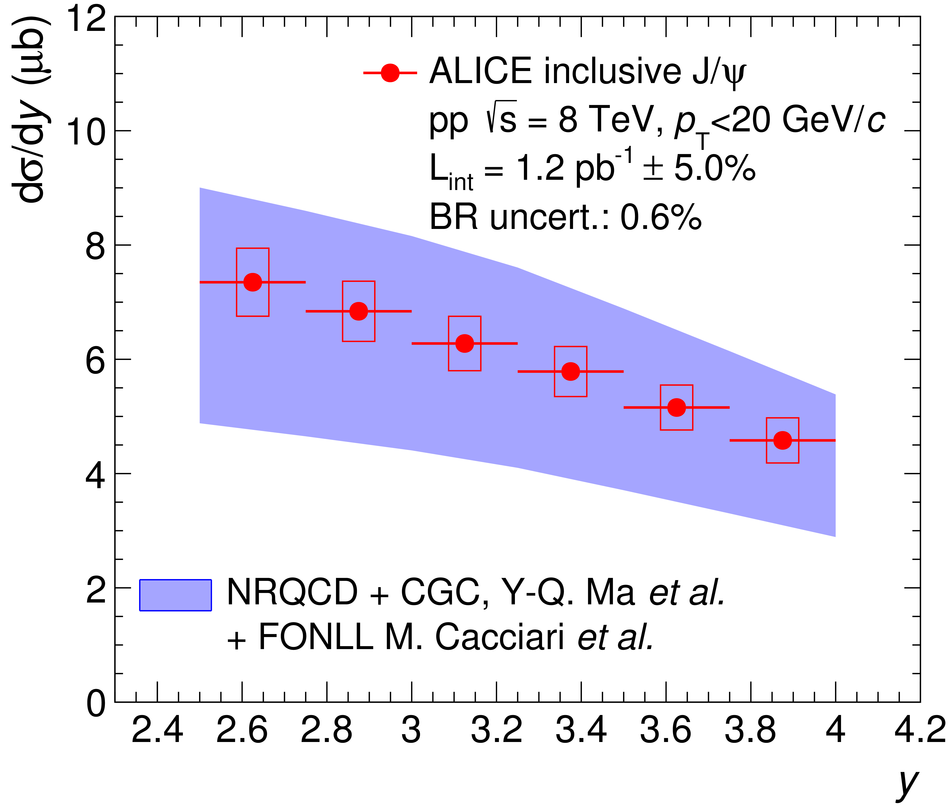 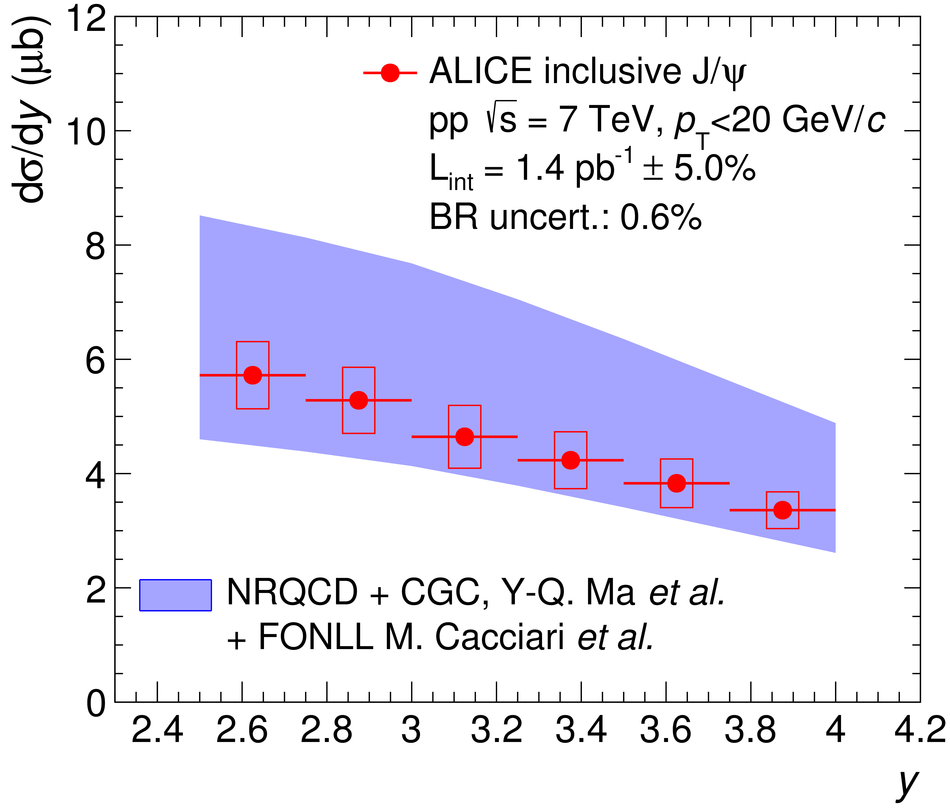 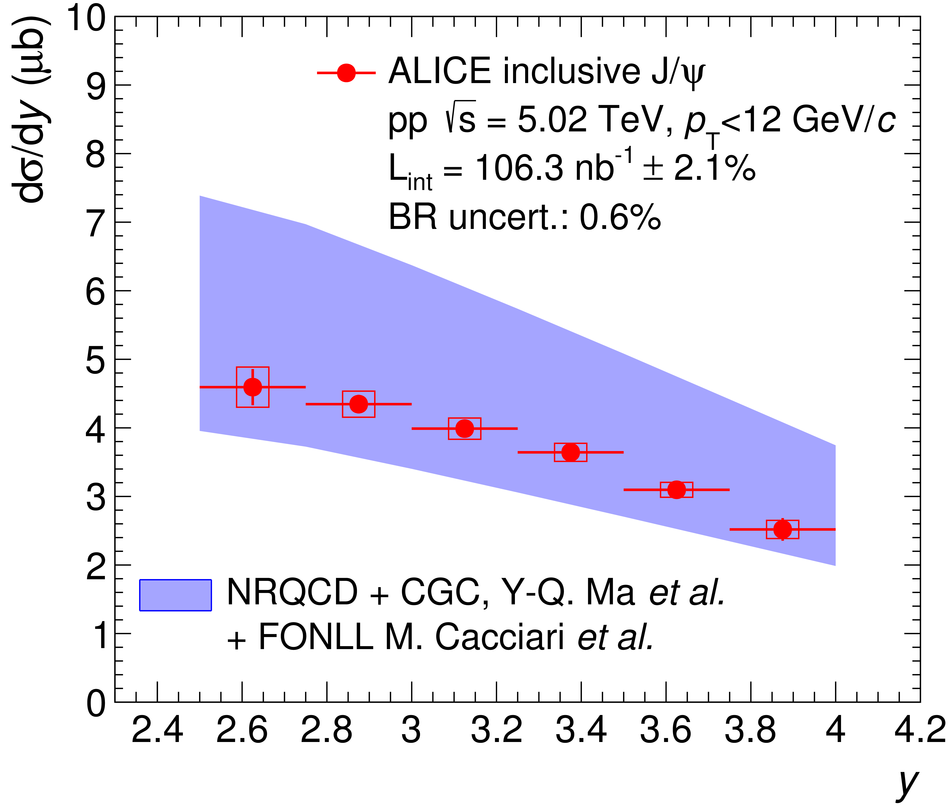 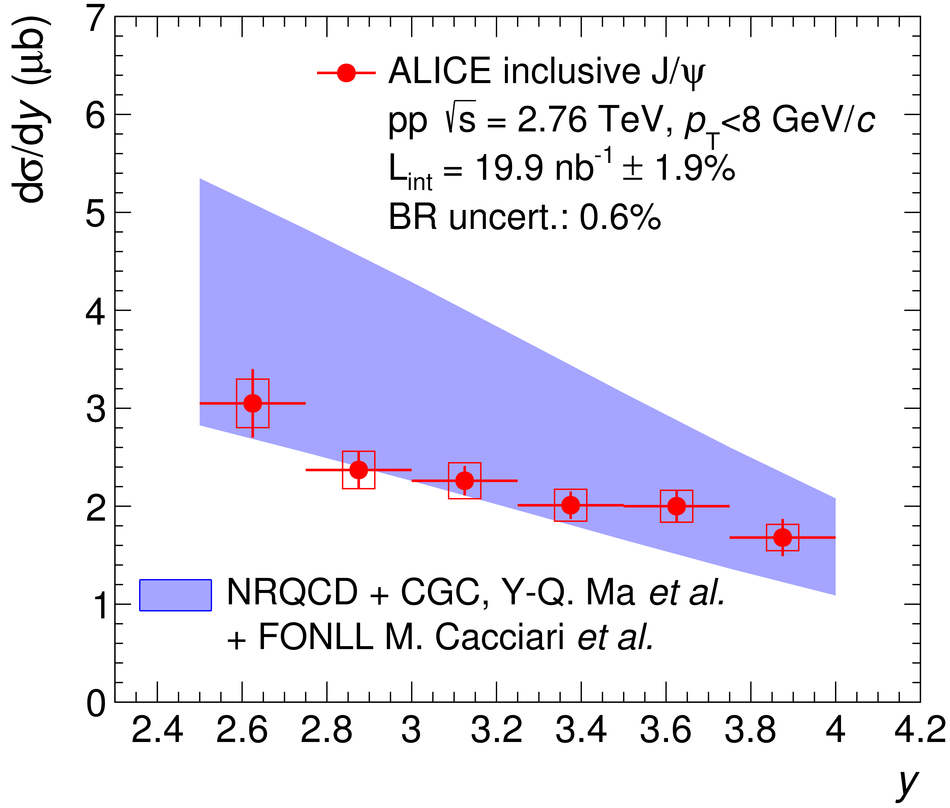 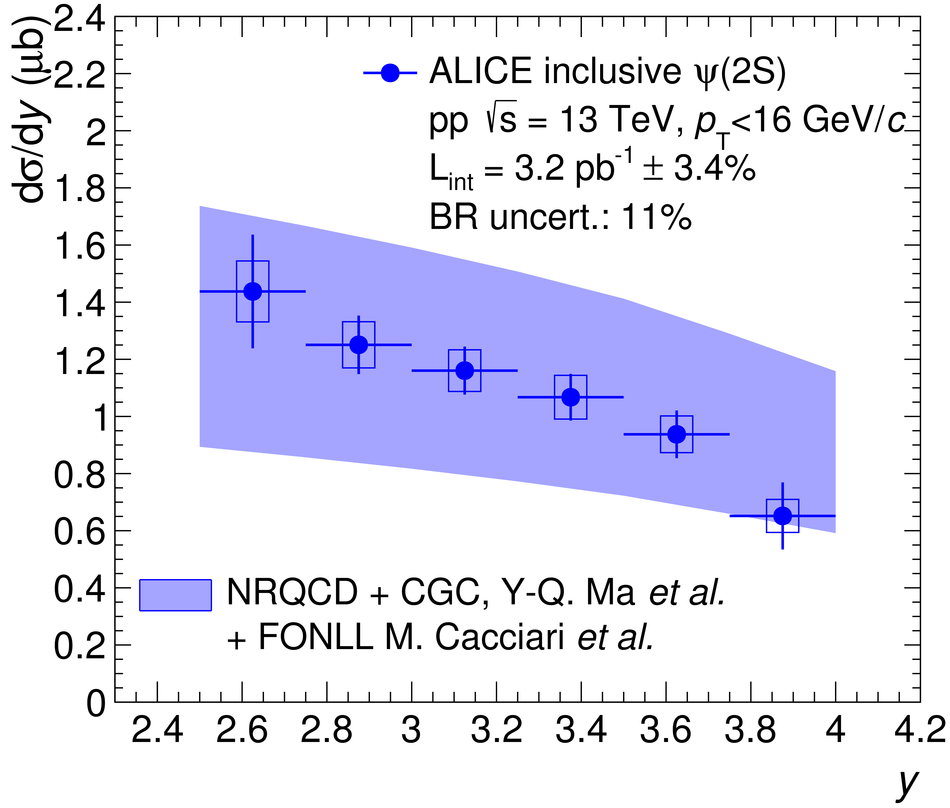  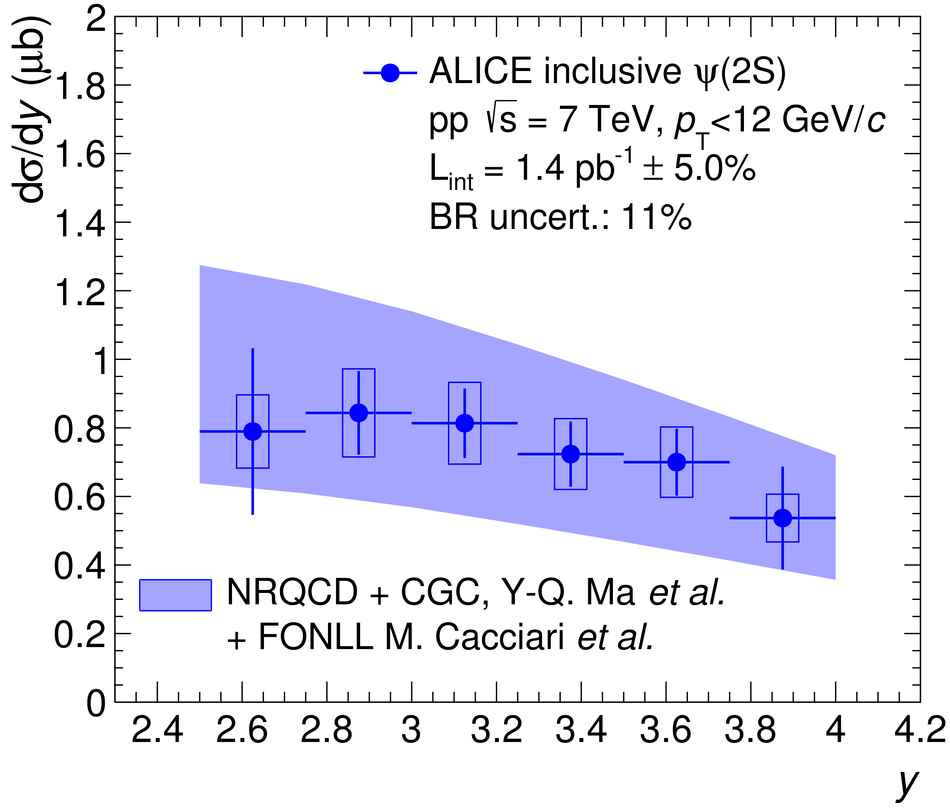 |
Figure 10
Comparisons between ALICE $\jpsi$ and $\psi(2S)$ data and summed NRQCD and FONLL model calculations from [39] and [37]. The first five panels correspond to inclusive $\jpsi$ production cross sections as a function of $\pt$ in pp collisions at $\sqrts=13$, $8$, $7$, $5.02$ and $2.76$ TeV (red), the next three panels to inclusive $\psi(2S)$ cross sections as a function of $\pt$ at $\sqrts=13$, $8$ and $7$ TeV (blue) and the last three panels to $\psi(2S)$-to-$\jpsi$ cross section ratios as a function of $\pt$ at the same $\sqrts$ (black). |  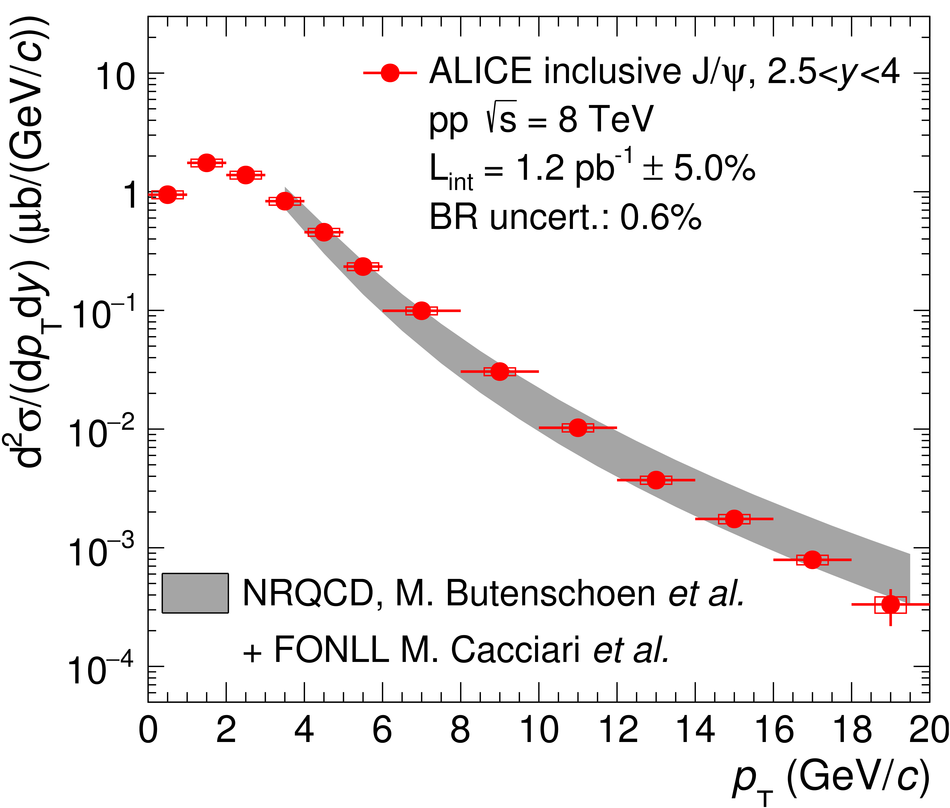 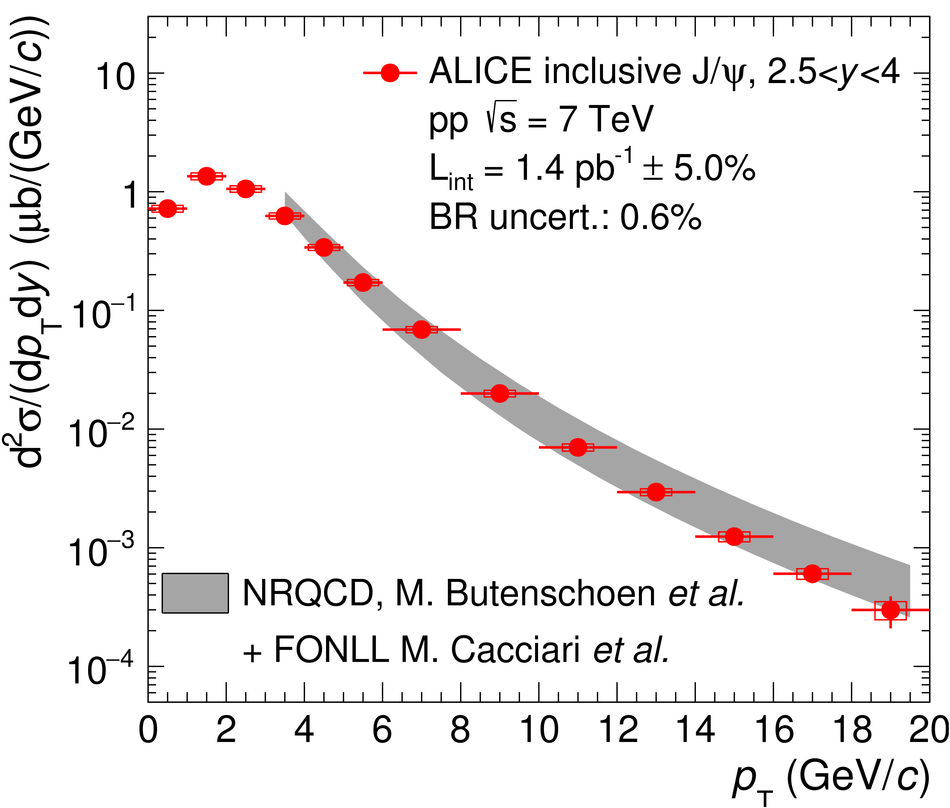 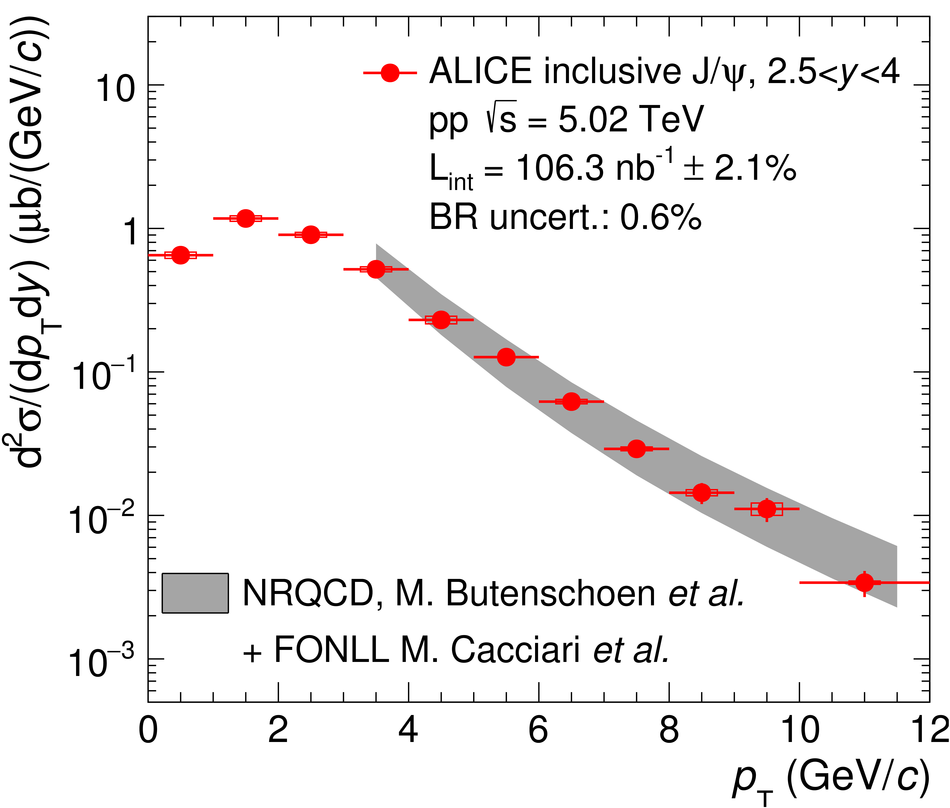 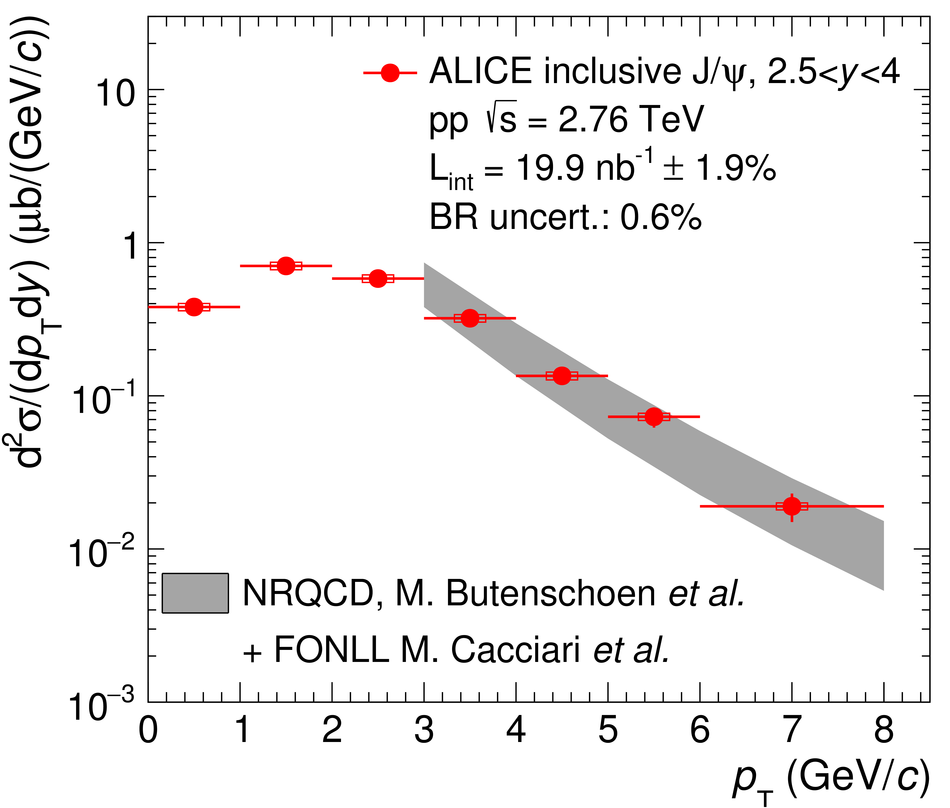 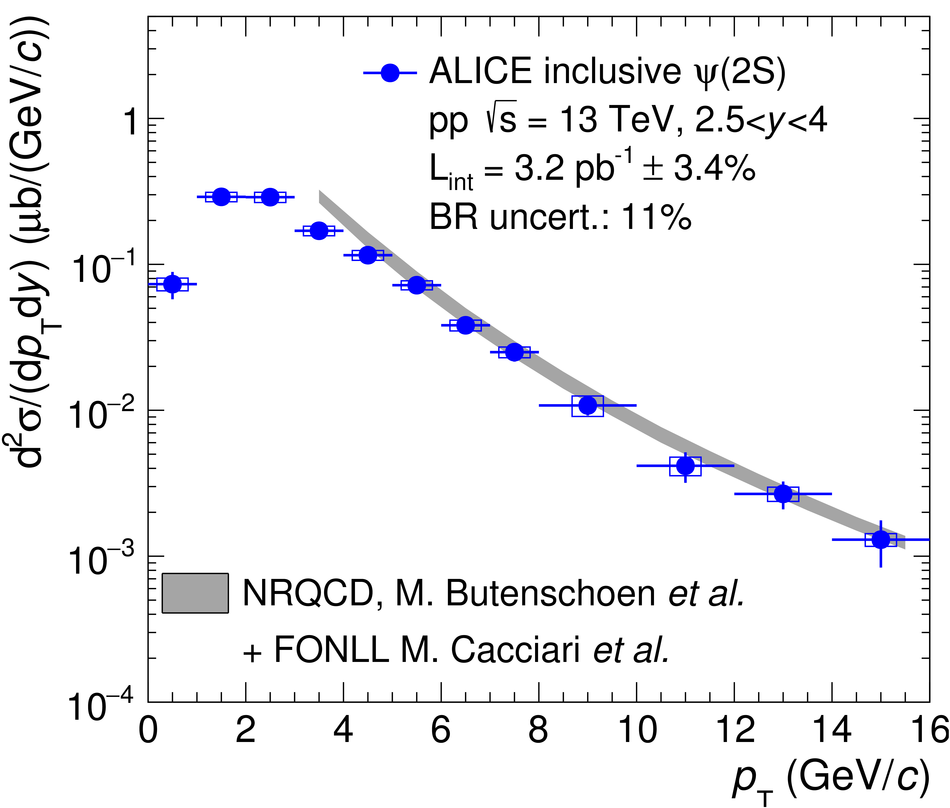 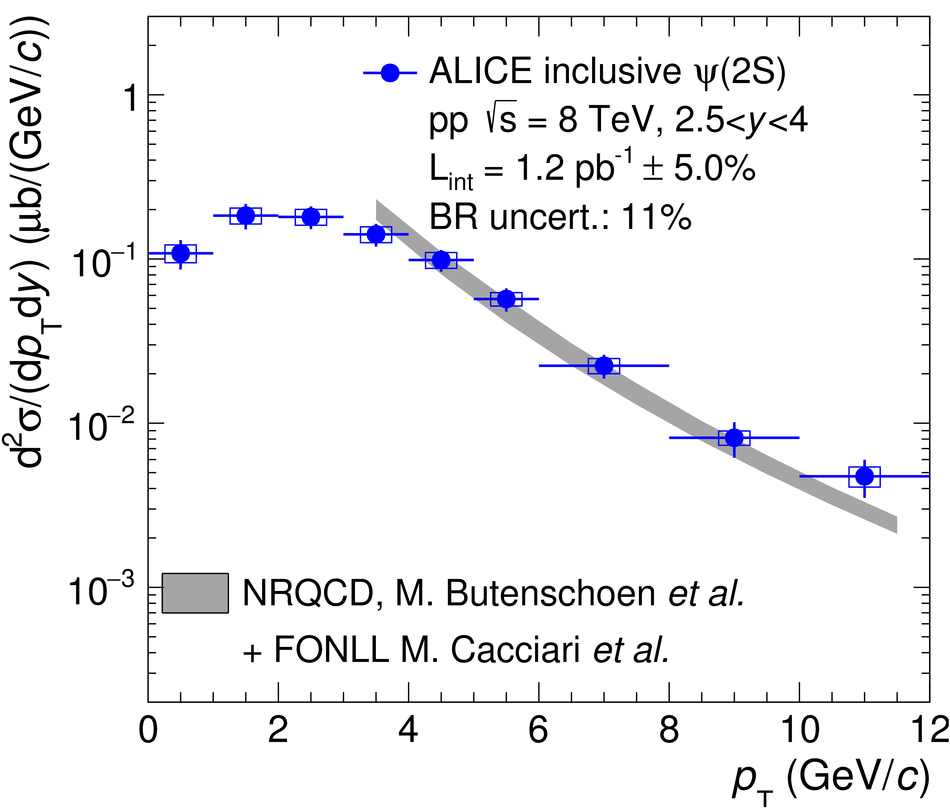 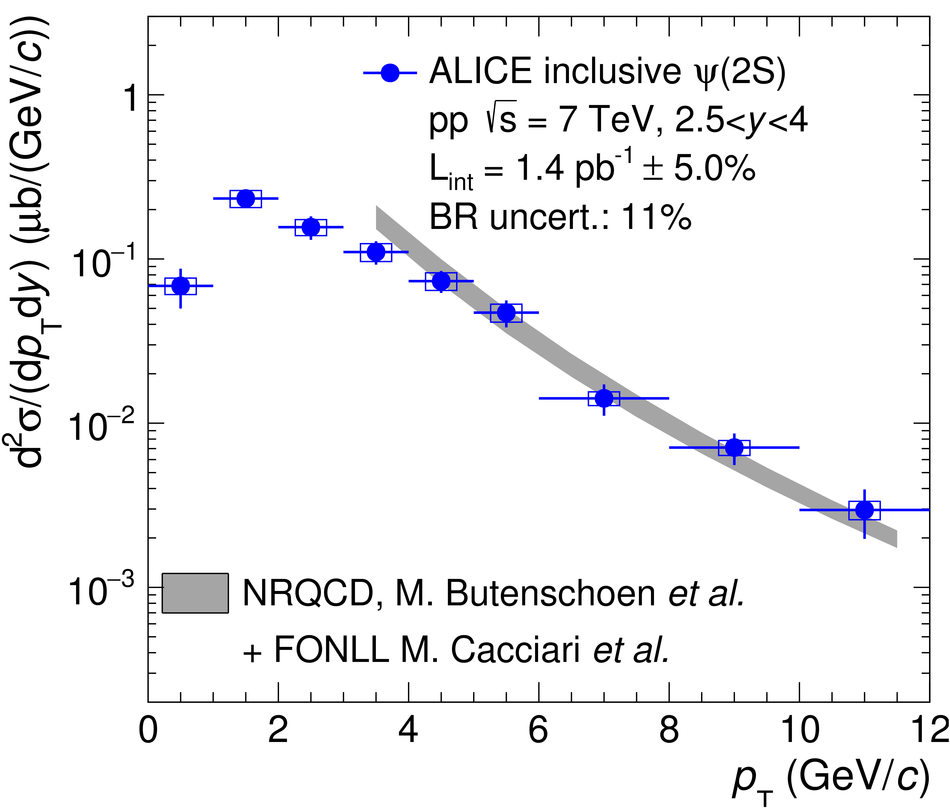 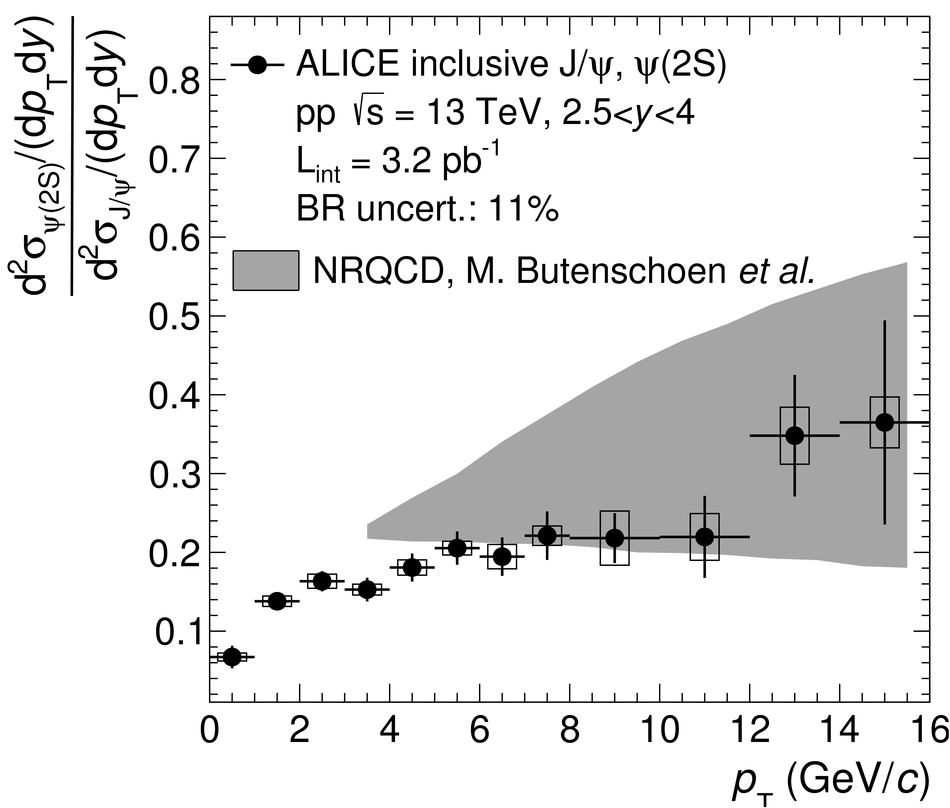 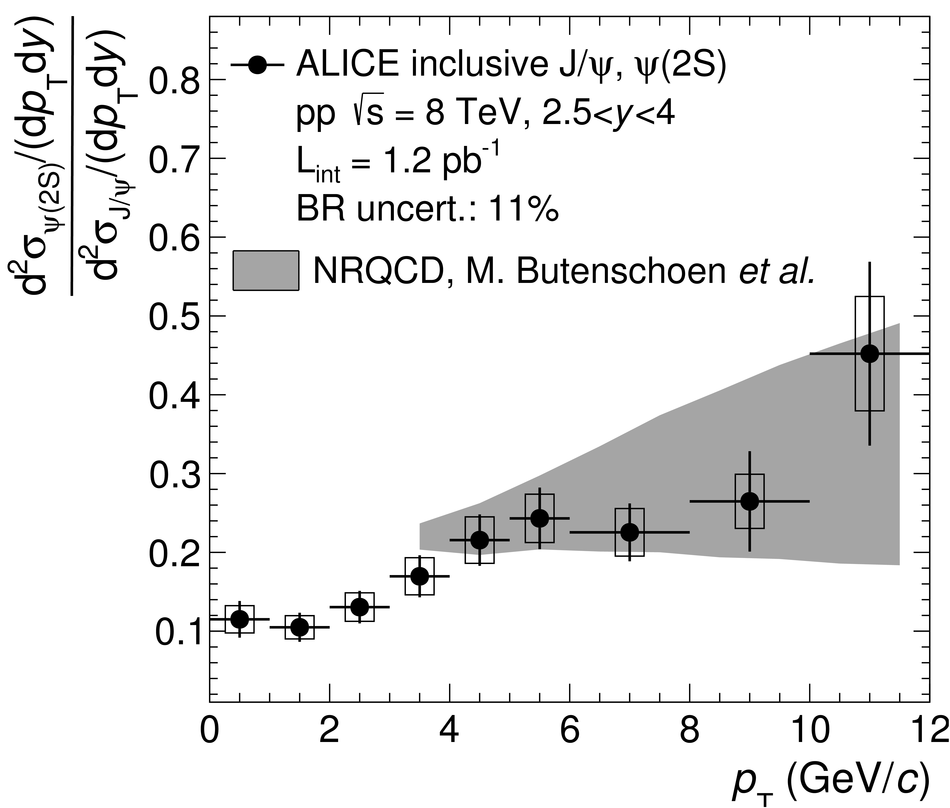  |