Ratio of the peak widths in Pb--Pb collisions to AMPT in central collisions (top panels) and peripheral collisions (centre panels) as well as in pp collisions to PYTHIA (bottom panels). Panel \protect\subref{subfig:absolute_ratio1a} show the shape parameters $\sigma_{\Dphi}$ while panel \protect\subref{subfig:absolute_ratio1b} show $\sigma_{\Deta}$. Lines indicate statistical uncertainties (mostly smaller than the marker size), while boxes denote systematic uncertainties | 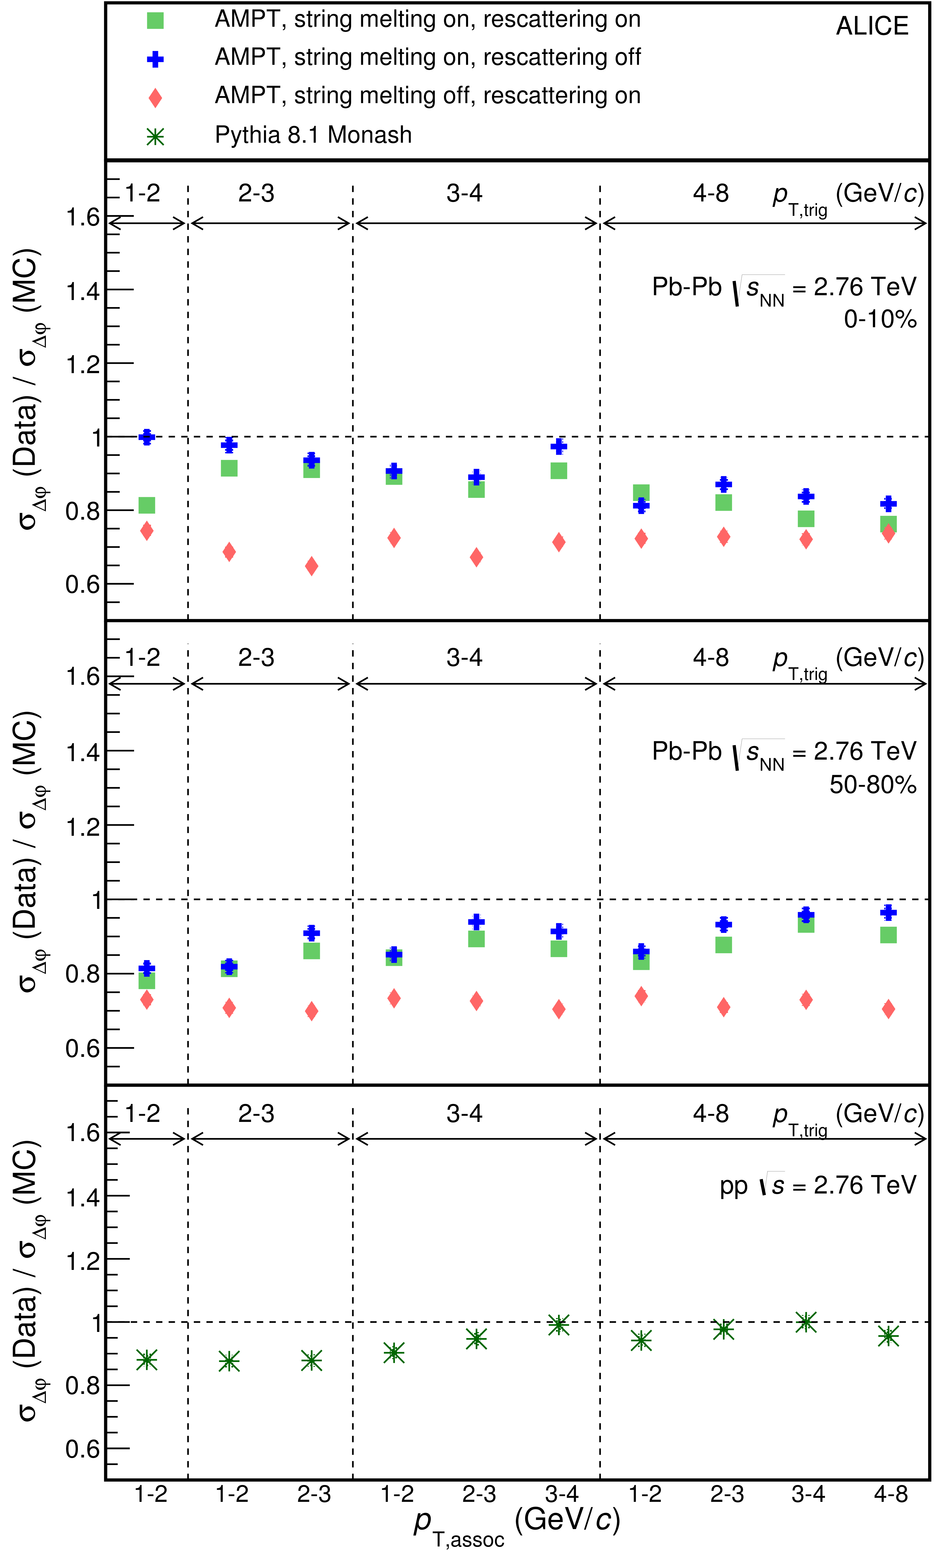 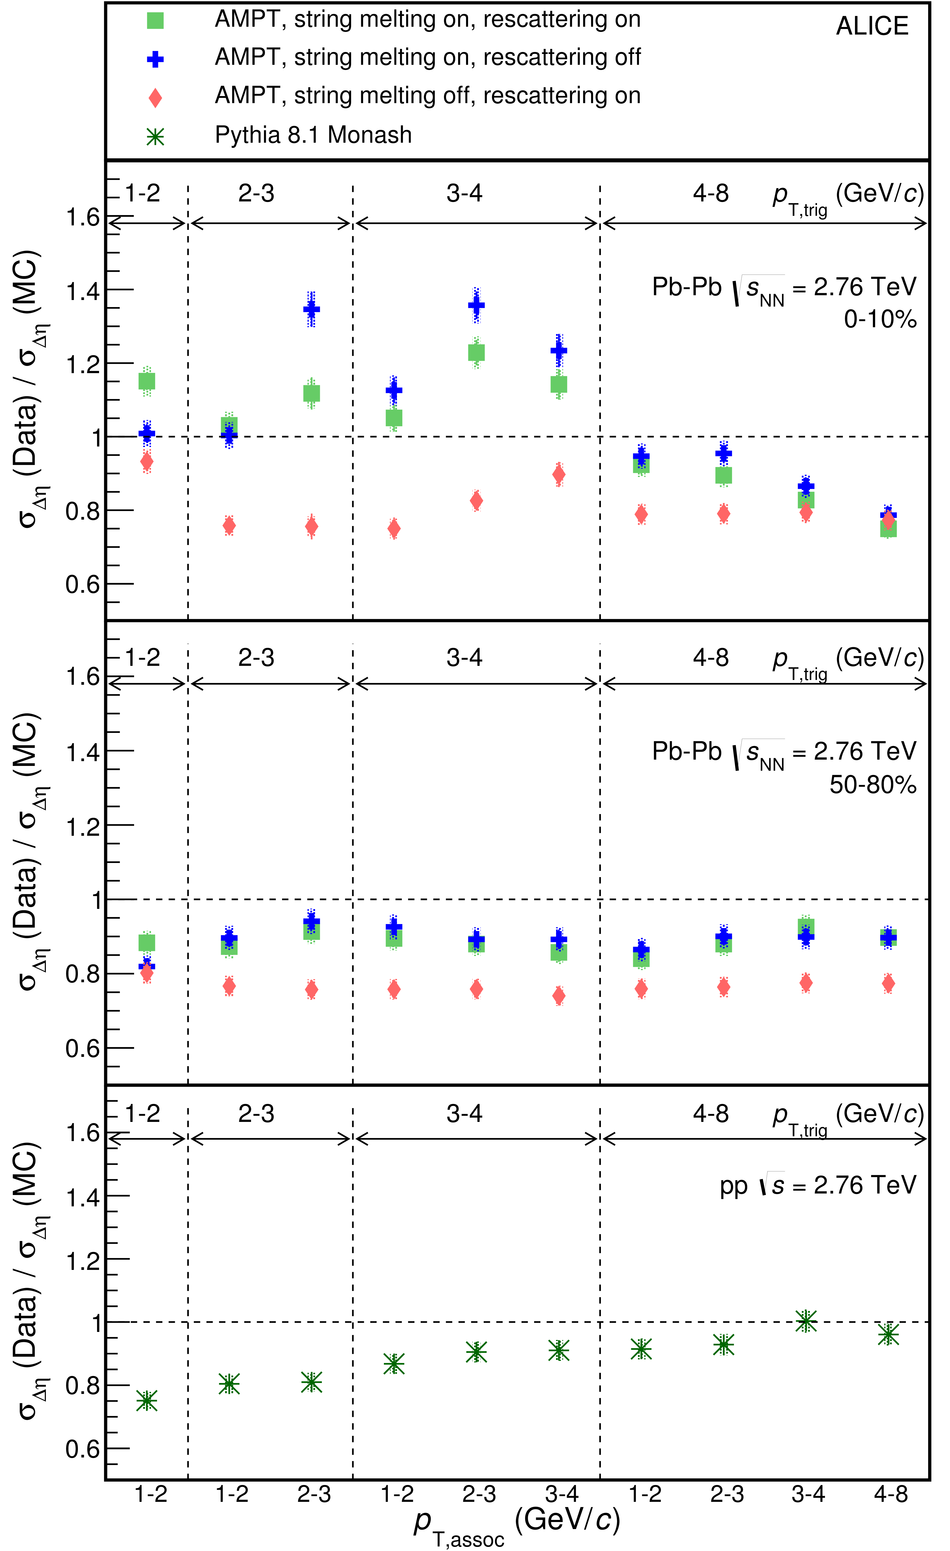 |