Impact parameter distribution for the interval $1.5< p_{\rm T}< 2.0$ GeV/$c$ in the 20% most central Pb-Pb collisions. The impact parameter value of each track was multiplied by the sign of the charge of each track and the sign of the magnetic field. The individual distributions for electrons from beauty- and charm-hadron decays, from Dalitz-decays of light mesons, and from photon conversions were obtained by HIJING and PYTHIA simulations. The bottom panel shows the ratio of the data and `Sum'. | 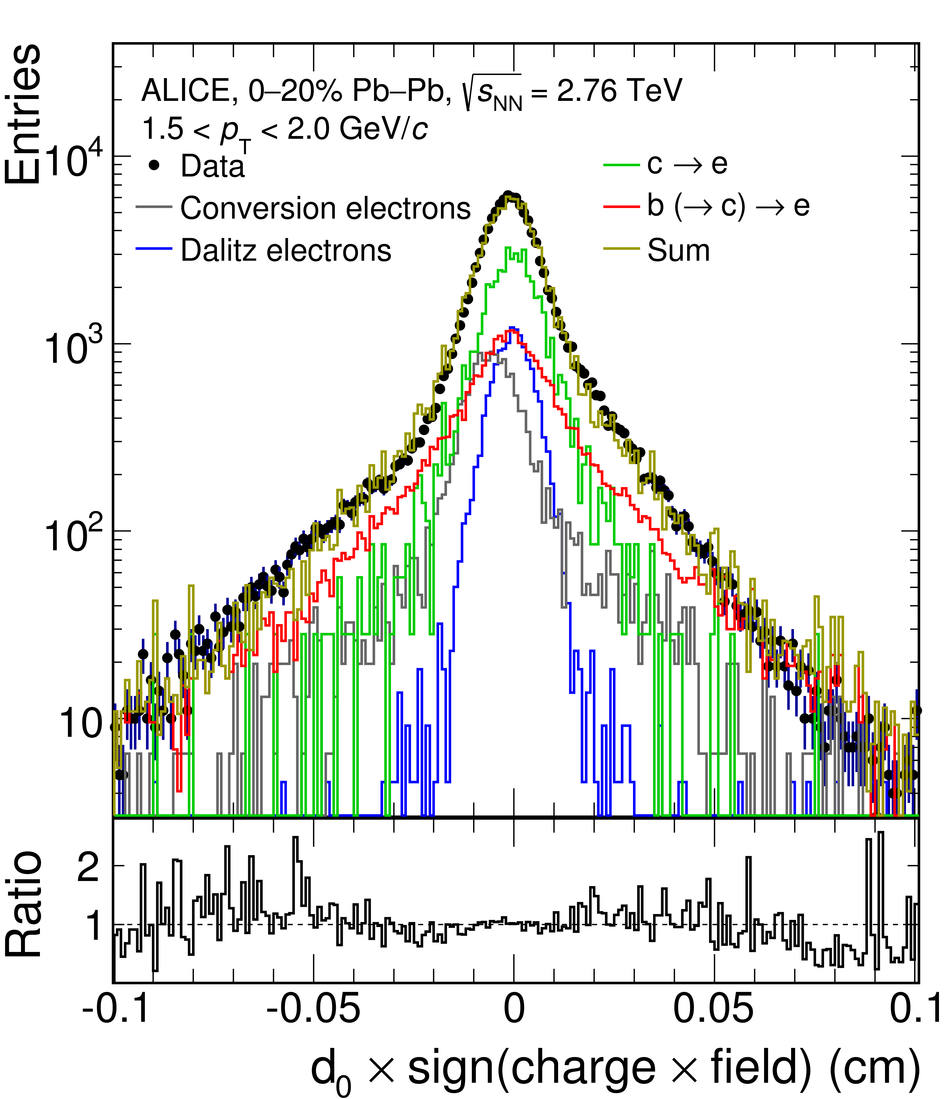 |