Average relative D-meson yield as a function of the relative charged-particle multiplicity at central rapidity in different $\pt$ intervals The systematic uncertainties on the data normalisation ($\pm3.1\%$), on the $(\dNdEta) \Big/ \langle \dNdEta \rangle$ values ($\pm6.3\%$), and on the feed-down contribution are not shown in this figure The calculations of EPOS 3.116 with and without hydro are also shown The coloured lines represent the calculation curves, whereas the shaded bands represent their statistical uncertainties at given values of $(\dNdEta) \Big/ \langle \dNdEta \rangle$ A diagonal (dashed) line is also shown to guide the eye | 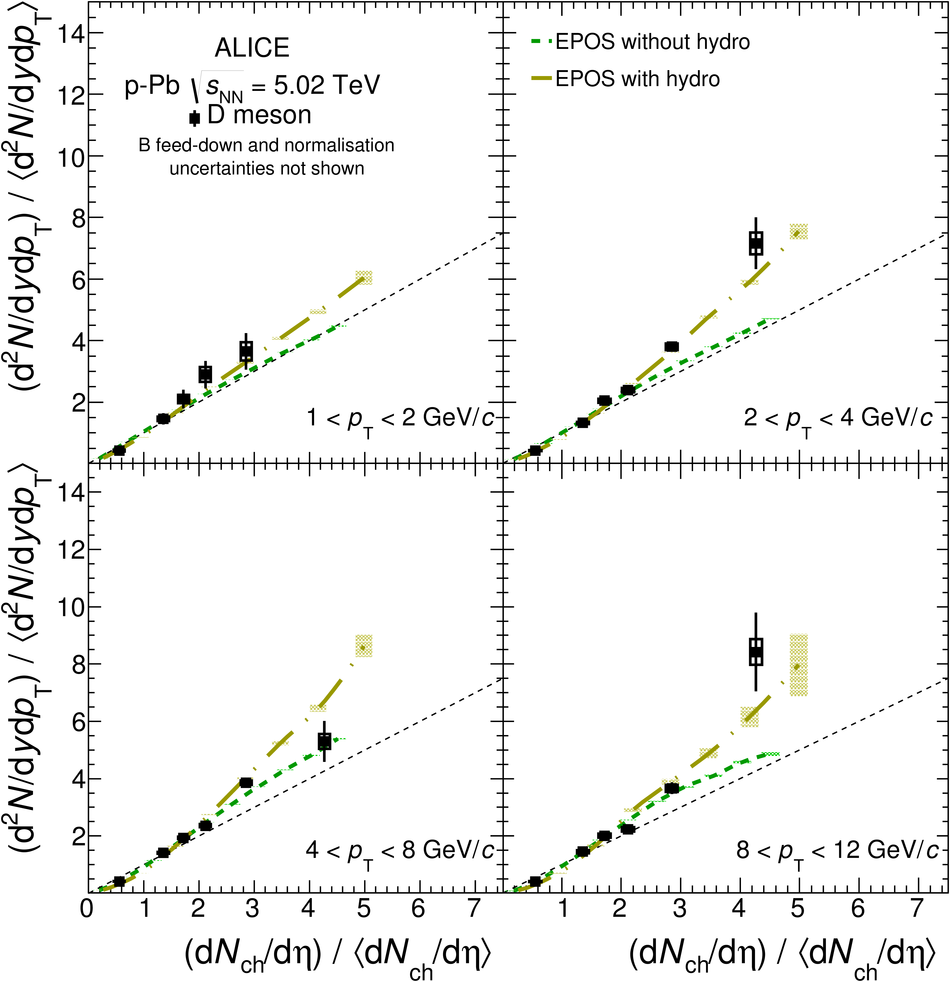 |