D$_{s}^+$ meson production at central rapidity in proton-proton collisions at $\sqrt{s}$ = 7 TeV

The $p_{\rm T}$-differential inclusive production cross section of the prompt charm-strange meson $\rm D_s^+$ in the rapidity range $|y|<~0.5$ was measured in proton-proton collisions at $\sqrt{s}=7$ TeV at the LHC using the ALICE detector. The analysis was performed on a data sample of $2.98 \times 10^8$ events collected with a minimum-bias trigger. The corresponding integrated luminosity is $L_{\rm int}=4.8$/nb. Reconstructing the decay ${\rm D_s^{+}\to \phi\pi^+}$, with $\phi\to {\rm K}^-{\rm K}^+$, and its charge conjugate, about 480 ${\rm D_s^{\pm}}$ mesons were counted, after selection cuts, in the transverse momentum range $2<~p_{\rm T}<~12$ Gev/$c$. The results are compared with predictions from models based on perturbative QCD. The ratios of the cross sections of four D meson species (namely ${\rm D^0}$, ${\rm D^+}$, ${\rm D^{*+}}$ and ${\rm D_s^+}$) were determined both as a function of $p_{\rm T}$ and integrated over $p_{\rm T}$ after extrapolating to full $p_{\rm T}$ range, together with the strangeness suppression factor in charm fragmentation. The obtained values are found to be compatible within uncertainties with those measured by other experiments in $\rm e^+e^-$, ep and pp interactions at various centre-of-mass energies.


Phys. Lett. B 718 (2012) 279-294
HEP Data
e-Print: arXiv:1208.1948 | PDF | inSPIRE
CERN-PH-EP-2012-227

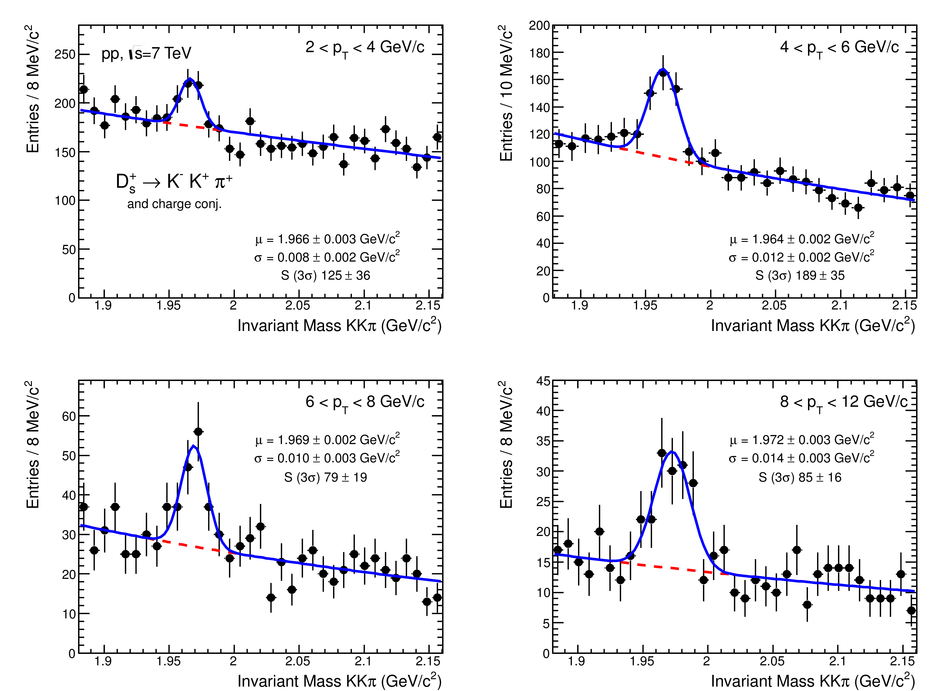
Figure 1

Invariant mass distributions for $\rm D_s^+$ candidates and charge conjugates in the four considered $\pt$ intervals. The fit functions described in the text are also shown. The values of mean ($\mu$) and width ($\sigma$) of the signal peak are reported together with the signal counts (S) integrated in$\pm3\sigma$ around the centroid of the Gaussian.

Figure 2

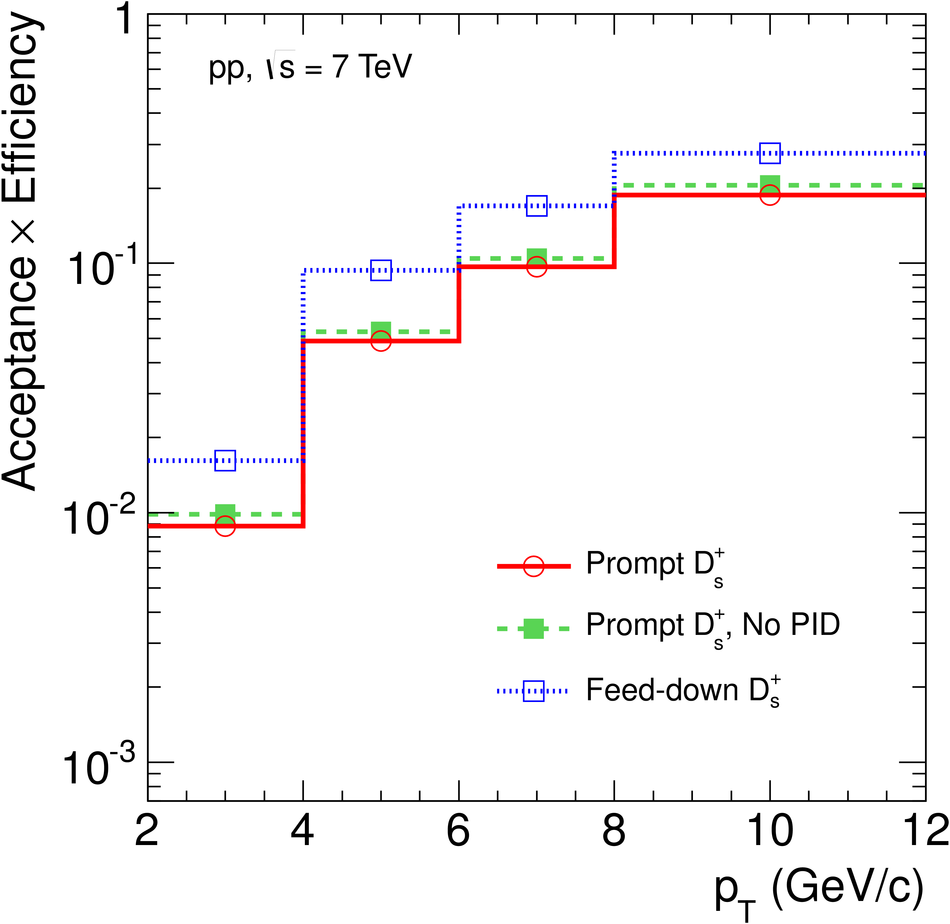
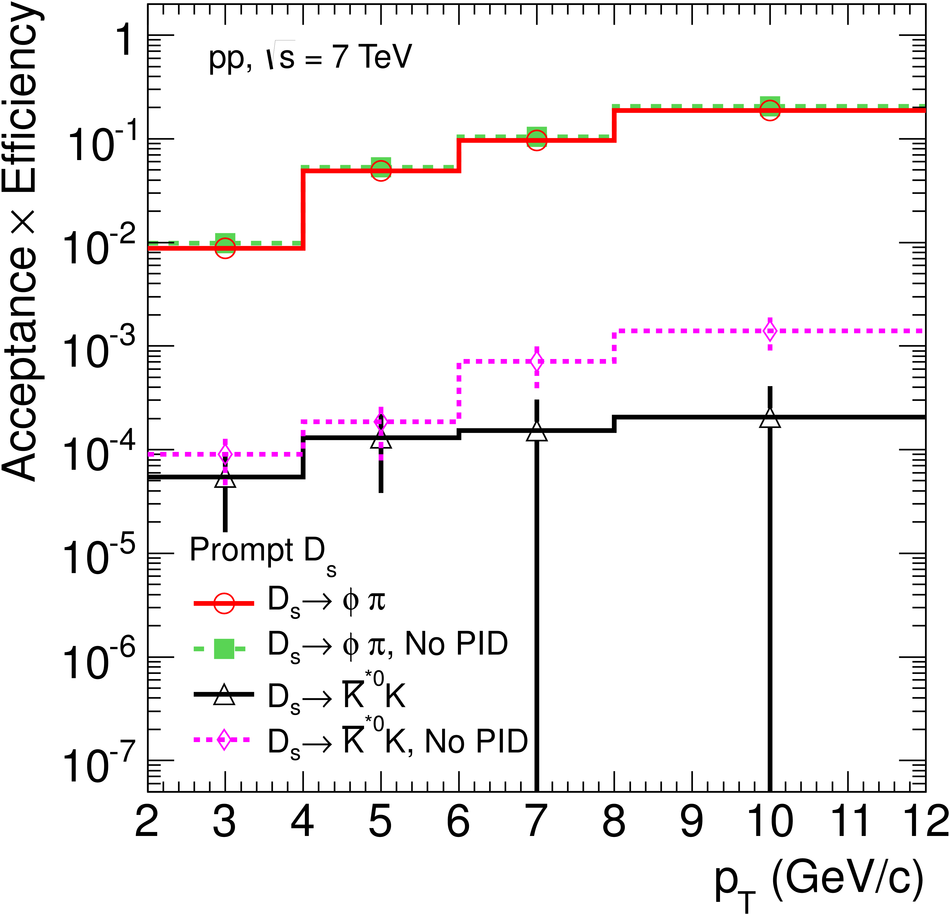
Acceptance $\times$ efficiency for $\rm D_s^+$ mesons as a function of$\pt$, for prompt and feed-down $\rm D_s^+$ mesons (upper panel) and decays through$\phi$ and $\rm \overline{K}^{*0}$ intermediate resonant state (bottom panel).

Figure 3

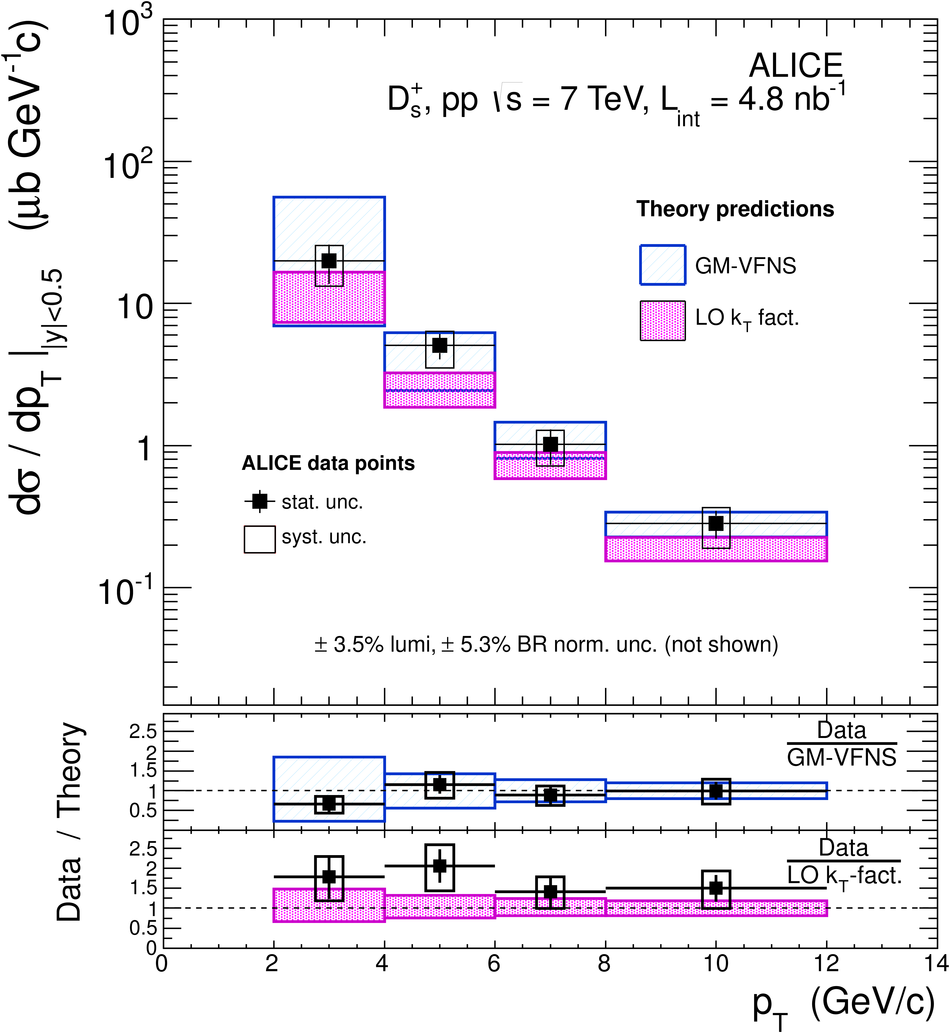
$\pt$-differential inclusive cross section for prompt $\rm D_s^+$ meson production in $\rm pp$ collisions at $\sqrt{s}=7$. TeV The symbols are positioned horizontally at the centre of each $\pt$ interval. The horizontal error bars represent the $\pt$ interval width. The normalization uncertainty (3.5% from the minimum-bias crosssection and 5.3% from the branching ratio uncertainties) is not shown. Theoretical predictions from GM-VFNS and from $\kt$-factorization at LO are also shown.

Figure 4

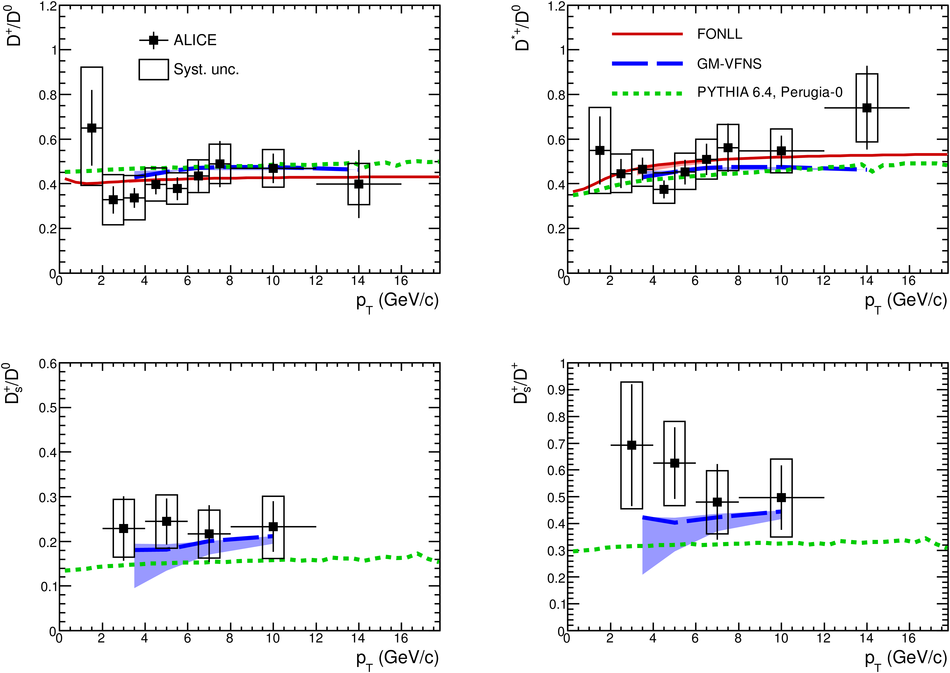
Ratios of D meson production cross sections as a function of $\pt$ Predictions from FONLL, GM-VFNS and PYTHIA 6.4.21 with the Perugia-0 tuneare also shown. For FONLL and GM-VFNS the line shows the ratio of the central values of the theoretical cross section, while the shaded area is defined by the ratios computed from the upper and lower limits of thetheoretical uncertainty band.

Figure 5

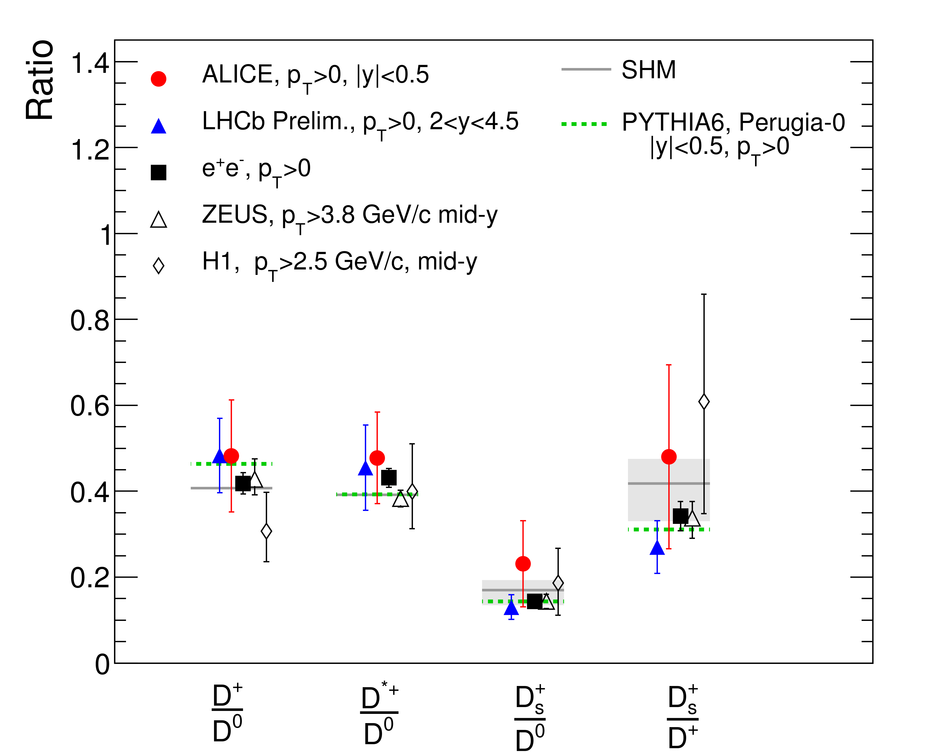
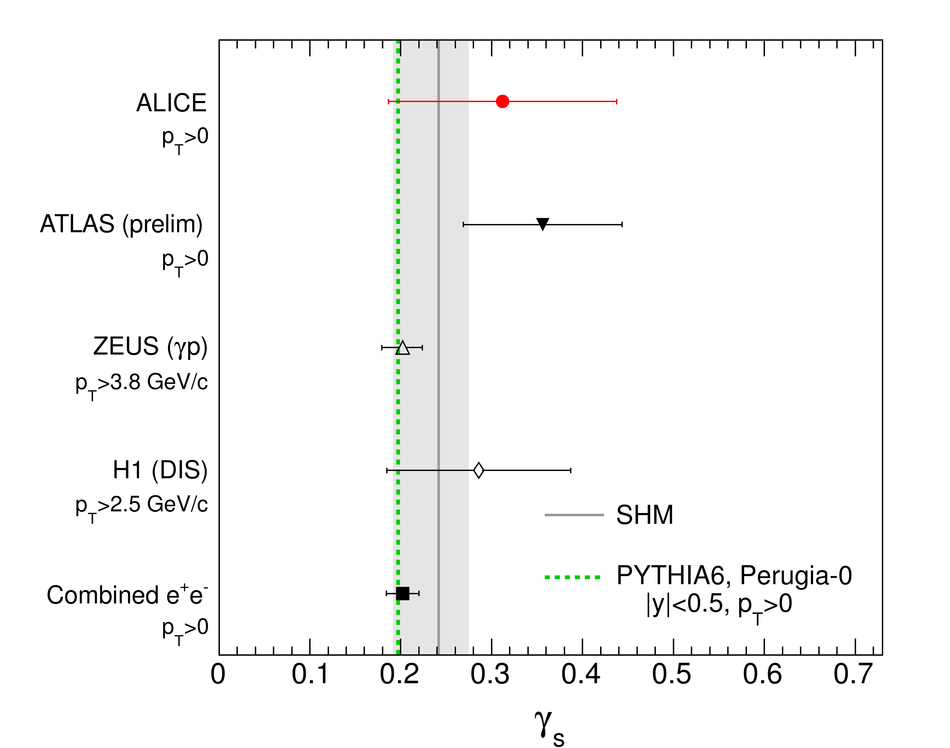
Left: $\pt$ integrated ratios of D meson production cross sections compared with other experiments. Error bars are the quadratic sum of statistical and systematic uncertainties, without including the uncertainty on the BR which is common to all experiments. Right: strangeness suppression factor $\gamma_{\rm s}$ compared to measurements by other experiments. Predictions from PYTHIA 6.4.21 with the Perugia-0 tune and from a canonical implementation of the statistical hadronization model (SHM) are also shown. The gray band represents the uncertainty on the SHM predictions due to the uncertainty on the volume and on the strangeness fugacity (see text for details).