We present measurements of two-particle correlations with neutral pion trigger particles of transverse momenta $8 <~ p_{\mathrm{T}}^{\rm trig} <~ 16~\mathrm{GeV}/c$ and associated charged particles of $0.5 <~ p_{\mathrm{T}}^{\rm assoc} <~ 10~\mathrm{GeV}/c$ versus the azimuthal angle difference $\Delta\varphi$ at midrapidity in pp and central Pb-Pb collisions at $\sqrt{s_{\mathrm{NN}}}=2.76$ TeV with ALICE. The new measurements exploit associated charged hadrons down to $0.5~\mathrm{GeV}/c$, which significantly extends our previous measurement that only used charged hadrons above $3~\mathrm{GeV}/c$. After subtracting the contributions of the flow background, $v_2$ to $v_5$, the per-trigger yields are extracted for $|\Delta\varphi|<~0.7$ on the near and for $|\Delta\varphi-\pi| <~ 1.1$ on the away side. The ratio of per-trigger yields in Pb-Pb to those in pp collisions, $I_{\mathrm{AA}}$, is measured on the near and away side for the $0$--$10$\% most central Pb-Pb collisions. On the away side, the per-trigger yields in Pb-Pb are strongly suppressed to the level of $I_{\mathrm{AA}} \approx 0.6$ for $p_{\mathrm{T}}^{\rm assoc} > 3~\mathrm{GeV}/c$, while with decreasing momenta an enhancement develops reaching about $5$ at low $p_{\mathrm{T}}^{\rm assoc}$. On the near side, an enhancement of $I_{\mathrm{AA}}$ between $1.2$ at the highest to $1.8$ at the lowest $p_{\mathrm{T}}^{\rm assoc}$ is observed. The data are compared to parton-energy-loss predictions of the JEWEL and AMPT event generators, as well as to a perturbative QCD calculation with medium-modified fragmentation functions. All calculations qualitatively describe the away-side suppression at high $p_{\mathrm{T}}^{\rm assoc}$. Only AMPT captures the enhancement at low $p_{\mathrm{T}}^{\rm assoc}$, both on the near and away side. However, it also underpredicts $I_{\mathrm{AA}}$ above $5$ GeV/$c$, in particular on the near-side.
PLB 763 (2016) 238-250
HEP Data
e-Print: arXiv:1608.07201 | PDF | inSPIRE
CERN-EP-2016-195
Figure 1
Cluster shower shape (top panel) and invariant mass (bottom panel) distributions for $8< E< 16$ GeV and $N_{\rm LM}=2$ compared between reconstructed $\pi^{0}$ candidates in data and clusters originating from $\pi^{0}$ in HIJING for $0$-$10$% Pb-Pb collisions. The distributions are shown after applying the energy-dependent selections on $\sigma^2_{\rm long}$ and $M_{\gamma\gamma}$. | 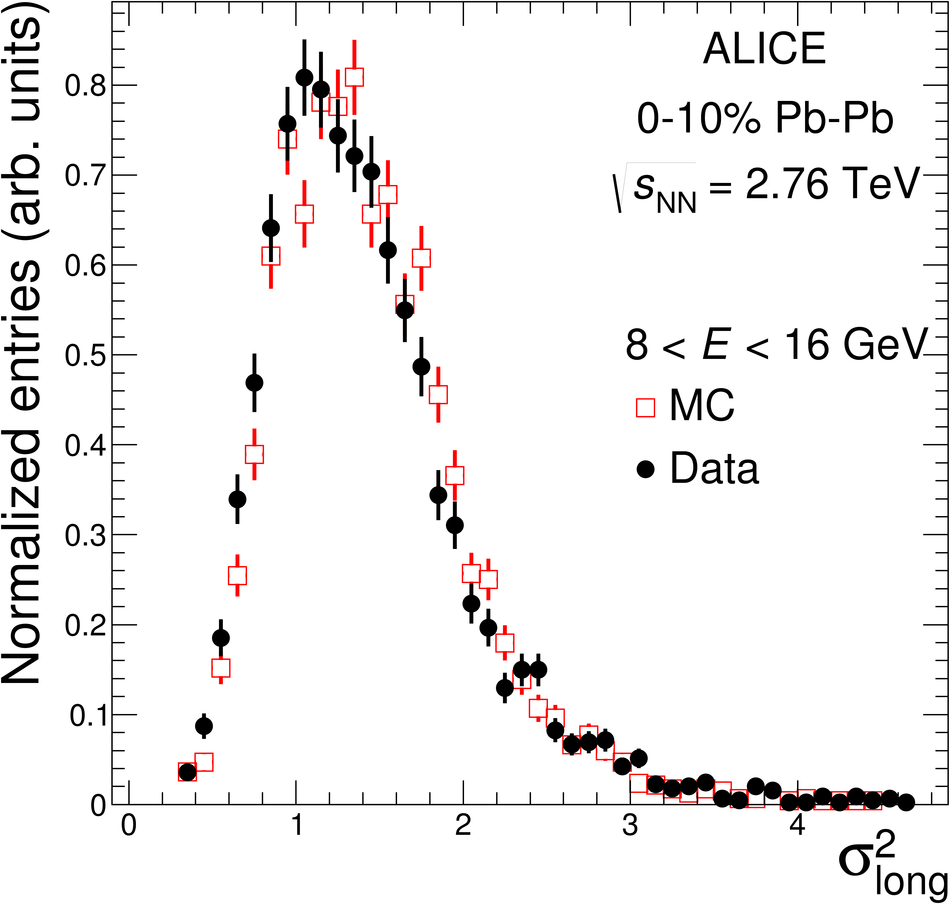 |

Figure 2
Charged-particle associated yields relative to $\pi^{0}$ trigger particles versus $\dphi$ in pp collisions at $\snn=2.76$ TeV. The $\pi^{0}$ trigger momentum range is $8< p_{\mathrm{T}}^{\rm trig} < 16 \mathrm{GeV}/c$, and associated charged particle ranges are $0.5 < p_{\mathrm{T}}^{\rm assoc} < 1$, $1 < p_{\mathrm{T}}^{\rm assoc} < 2$, $2 < p_{\mathrm{T}}^{\rm assoc} < 4$ and $4 < p_{\mathrm{T}}^{\rm assoc} < 6 \mathrm{GeV}/c$. The bars represent statistical uncertainties, the boxes uncorrelated systematic uncertainties. Dashed lines correspond to the estimated background using the ZYAM procedure described in the text. The range of the vertical axis is adjusted for each panel, and ``zero'' is not shown in all cases | 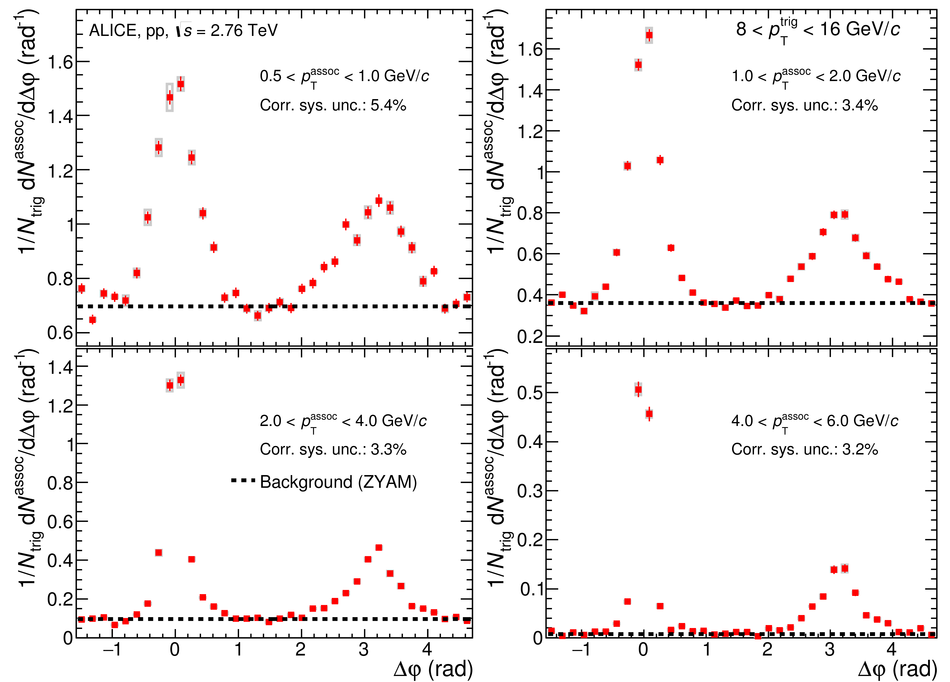 |
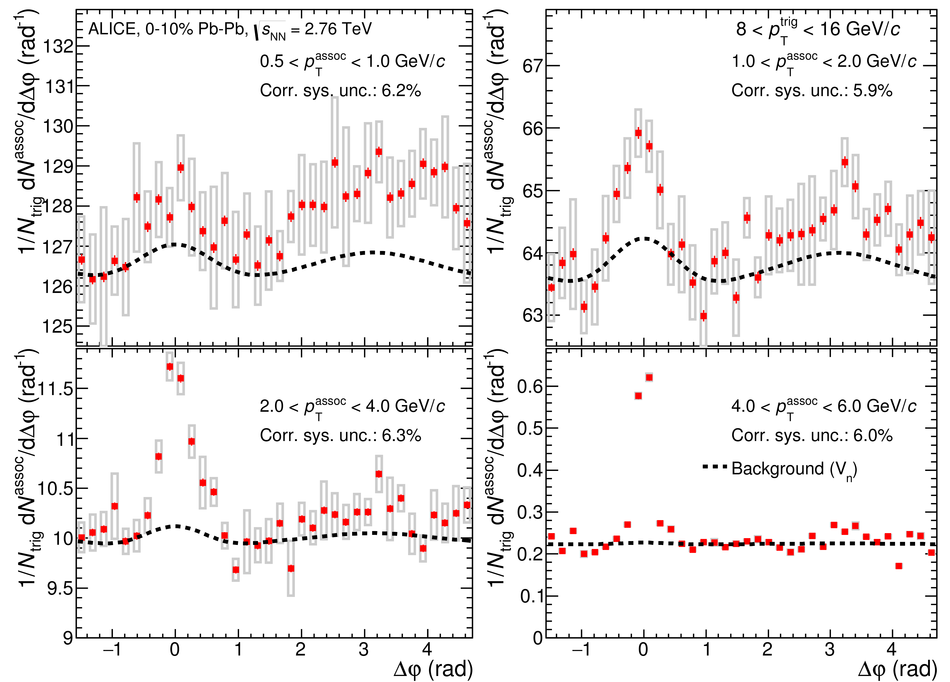
Figure 4
Per-trigger yield modification, $I_{\rm AA}$, on the near side(top) and away side(bottom) with trigger $\pi^{0}$ particle at $8< p_{\mathrm{T}}^{\rm trig} < 16 \mathrm{GeV}/c$ for 0-10% Pb-Pb collisions at $\snn=2.76$ TeV. The data from our previous measurement using di-hadron correlations are slightly displaced for better visibility. The bars represent statistical and the boxes systematic uncertainties. | 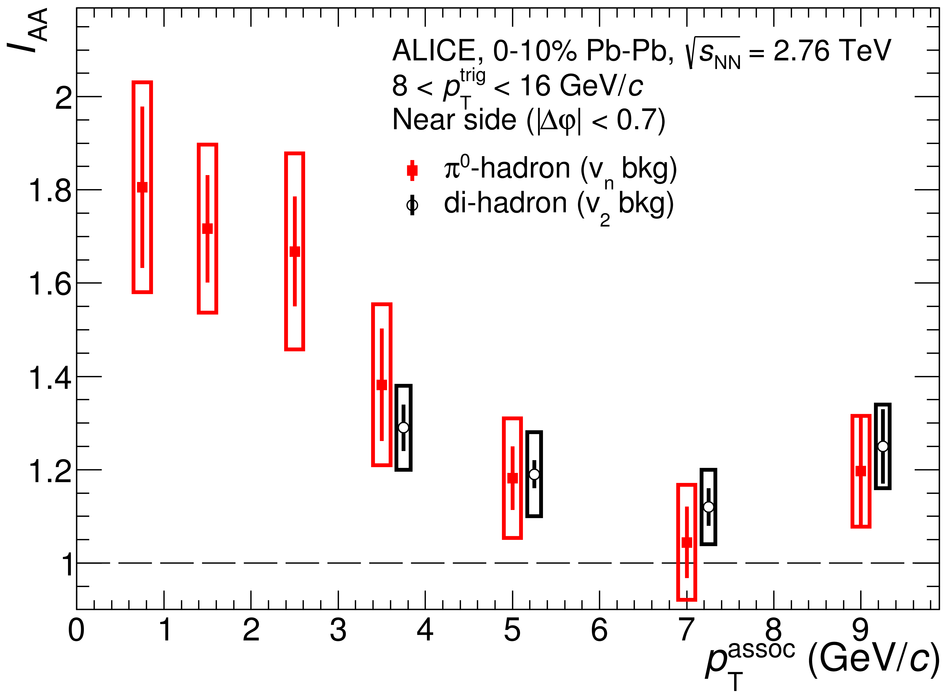 |
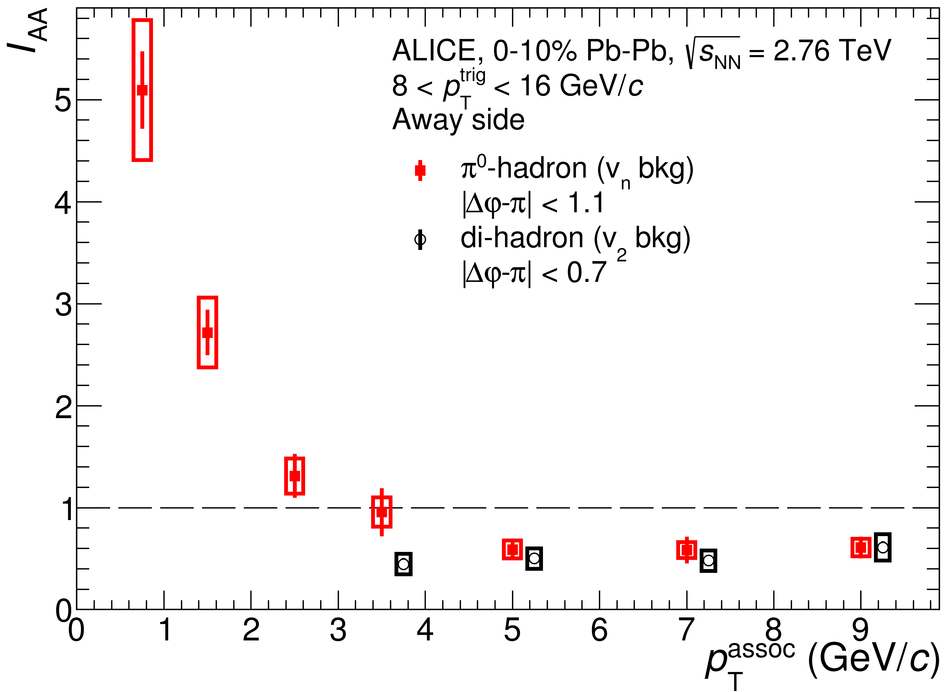
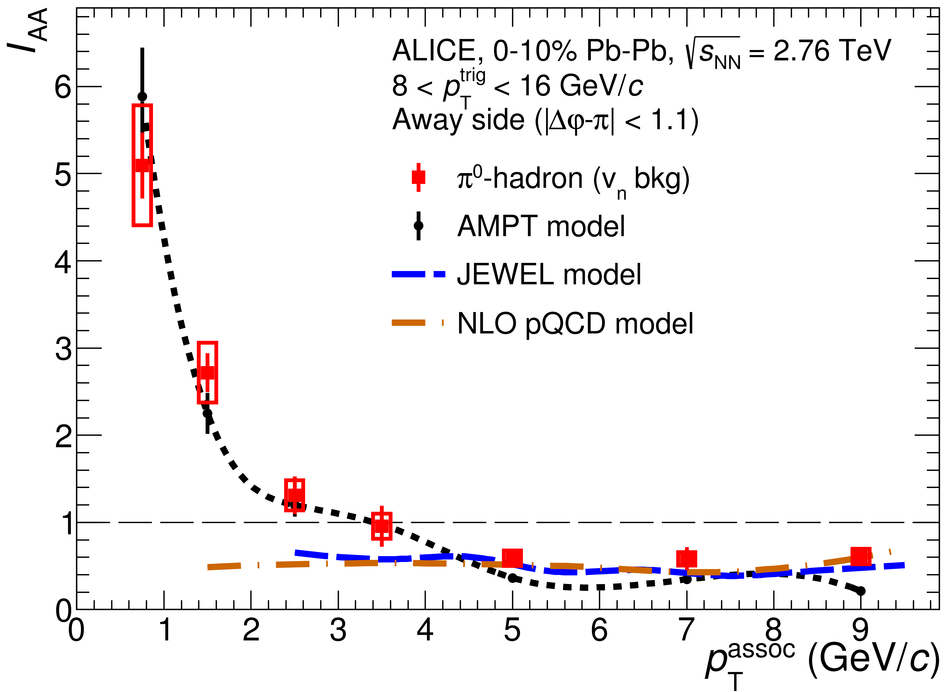
Figure 5
Per-trigger yield modification, $I_{\rm AA}$, on the near side(top) and away side(bottom) with trigger $\pi^{0}$ particle at $8< p_{\mathrm{T}}^{\rm trig} < 16 \mathrm{GeV}/c$ for 0-10% Pb-Pb collisions at $\snn=2.76$ TeV. The data are compared to model calculations as explained in the text. The bars represent statistical and the boxes systematic uncertainties. |  |