$\frac{{\rm d}\sigma_{\rm prompt \; J/\psi}}{{\rm d}y}$ as a function of $y$ The error bars represent the quadratic sum of the statistical and systematic errors, while the systematic uncertainties on luminosity and branching ratio are shown as boxes around the data points. The symbols are plotted at the center of each bin The CMS value was obtained by integrating the published d$^{2}\sigma_{\rm prompt \; J/\psi }$/d$\pt$d$y$ data measured for $1.6< \left| y \right|< 2.4$. The results obtained by LHCb and CMS are reflected with respect to $y = 0$ (open symbols). | 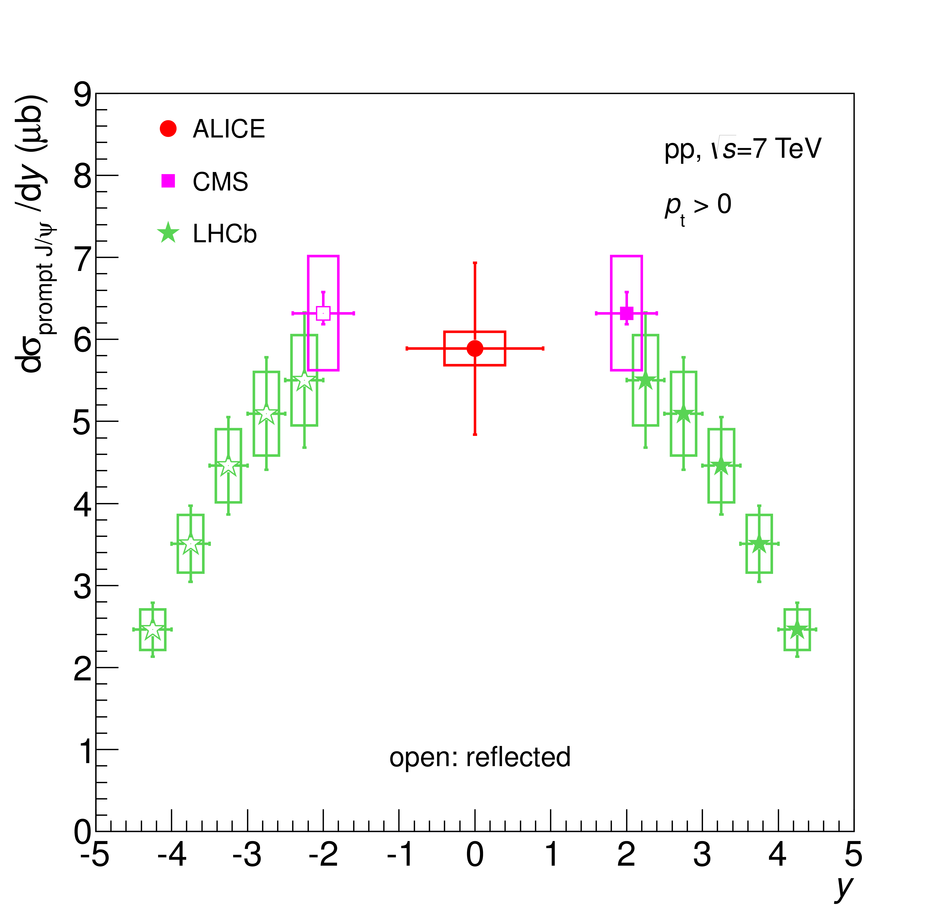 |