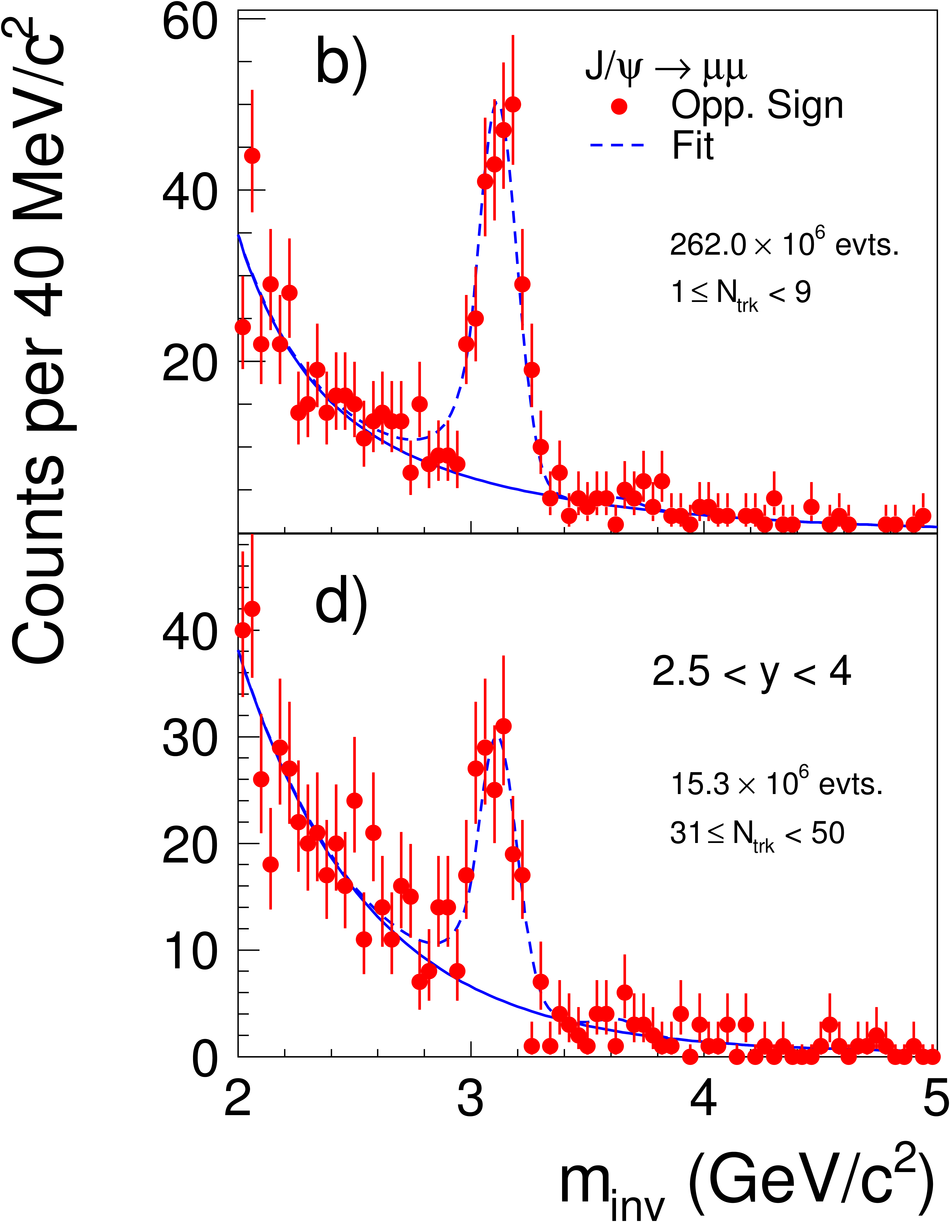
Opposite sign invariant mass spectra of the selected electron[(a) + (c)] and muon [(b) + (d)] pairs (filled symbols) for the lowest [(a) + (b)] and highest [(c) + (d)] multiplicity intervals. Also shown are the estimates of the combinatorial background which are based on a fit to the $\mu^{+}\mu^-$ pair distributions (solid line), and on like-sign pairs (open circles), as well as track rotation (open squares), in the e$^{+}$e$^{-}$ case. The number of events quoted in the figures refer to the corresponding minimum bias triggered events. | 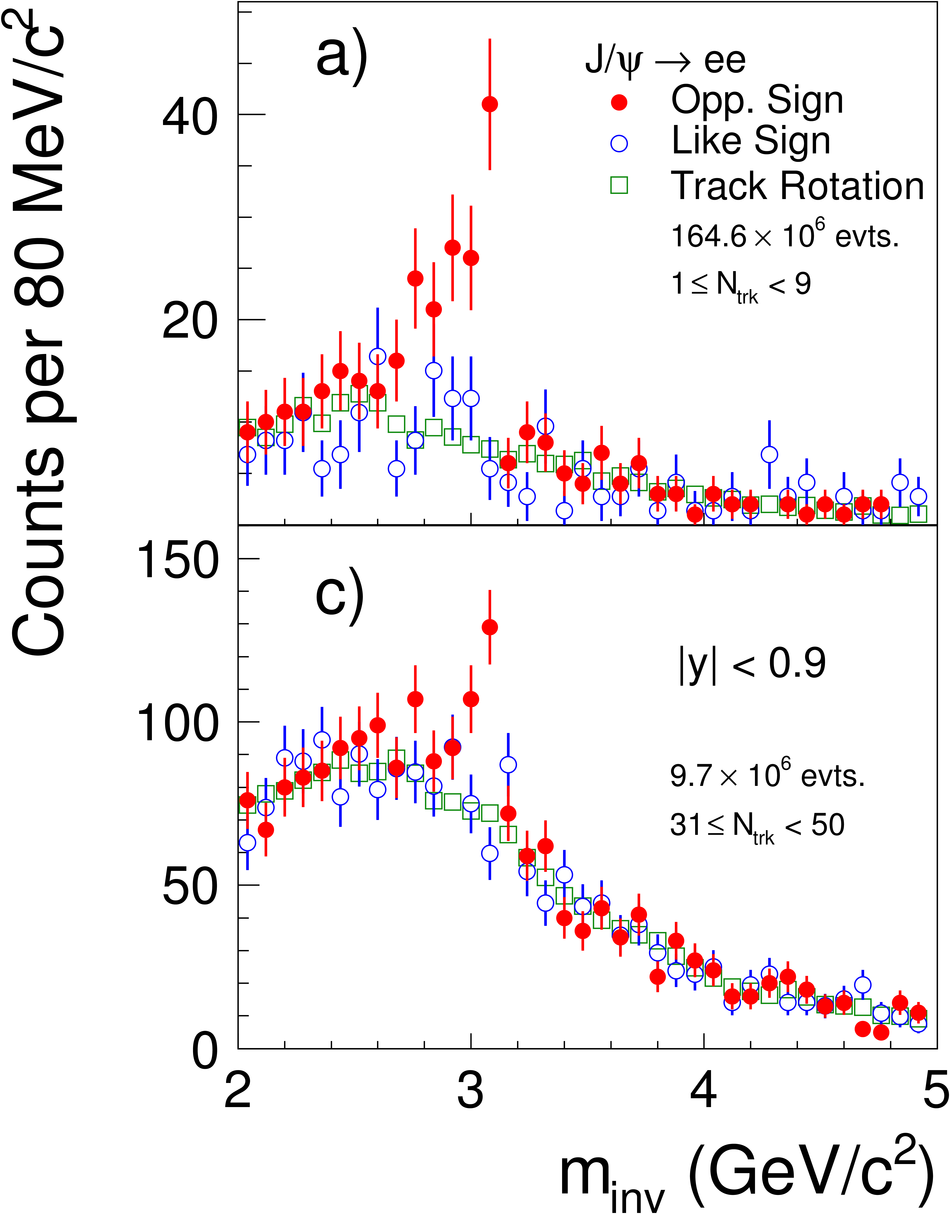 |