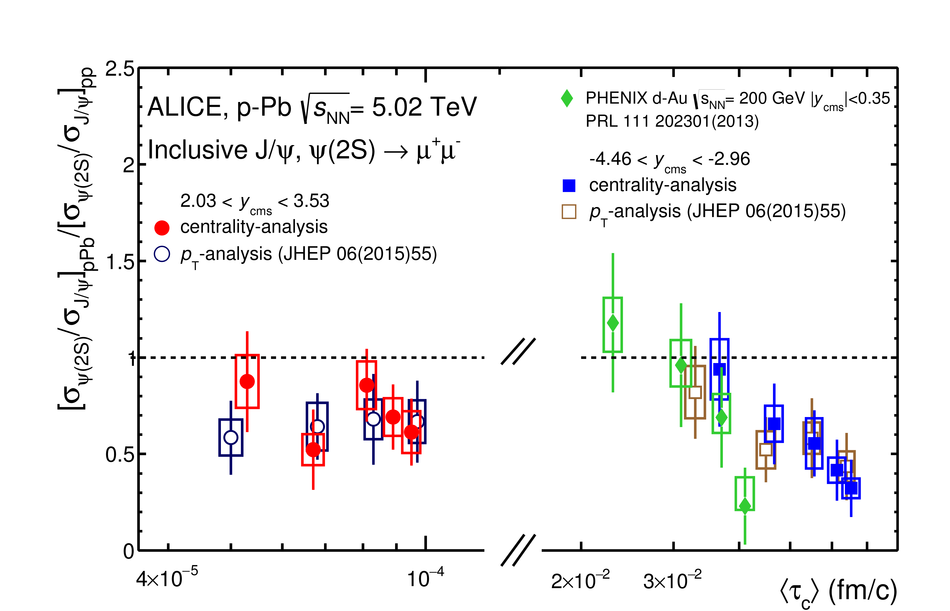
Double ratio $[\sigma_{\psi(\rm 2S)}/\sigma_{{\rm J}/\psi}]_{\rm pPb}/[\sigma_{\psi(\rm 2S)}/\sigma_{{\rm J}/\psi}]_{\rm pp}$ shown as a function of $\tau_c$ for the backward and forward rapidity regions. For each $y$-range, the two sets of points were obtained from the centrality analysis and from the $p_{\rm T}$-dependent analysis of Ref.[22]. Statistical uncertainties are shown as lines, while the total systematic uncertainties are shown as boxes around the points. The results of a corresponding analysis carried out on the PHENIX mid-rapidity data is also shown. The box around unity represents the PHENIX global systematic uncertainty. For the ALICE results, the global uncertainties are different for the various data sets, and are included in the boxes around the points. |  |