Left: Associated yield per trigger particle in $\Dphi$ and $\Deta$ for pairs ofcharged particles with $2< p_{\mathrm{T, trig}}< 4$ GeV/$c$ and $1< p_{\mathrm{T, assoc}}< 2$ GeV/$c$ in p-Pb collisions at $\snn=5.02$ TeV for the 0-20$\%$ multiplicity class, after subtraction of the associated yield obtained in the 60-100$\%$ event class. Top right: the associated per-trigger yield after subtraction (as shown on the left) projected onto $\Deta$ averaged over $|\Dphi| < \pi/3$ (black circles), $|\Dphi - \pi| < \pi/3$ (red squares), and the remaining area (blue triangles, $\Dphi < -\pi/3$, $\pi/3 < \Dphi < 2\pi/3$ and $\Dphi > 4\pi/3$). Bottom right: as above but projected onto $\Dphi$ averaged over $0.8 < |\Deta| < 1.8$ on the near side and $|\Deta| < 1.8$ on the away side. Superimposed are fits containing a $\cos(2\Dphi)$ shape alone (black dashed line) and a combination of $\cos(2\Dphi)$and $\cos(3\Dphi)$ shapes (red solid line). The blue horizontal line shows the baseline obtained from the latter fit which is used for the yield calculation. Also shown for comparison is the subtracted associated yield when the same procedure is applied on HIJING shifted to the same baseline. The figure shows only statistical uncertainties. Systematic uncertainties are mostly correlated and affect the baseline. Uncorrelated uncertainties are less than 1$\%$. |   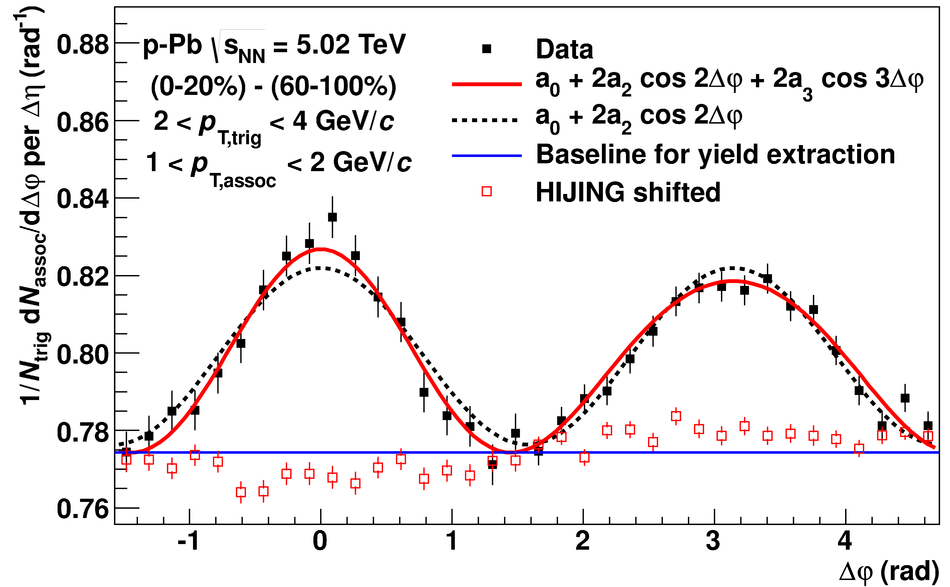 |