The differential production cross section of electrons from semileptonic heavy-flavour hadron decays has been measured at mid-rapidity ($|y| <~ 0.5$) in proton-proton collisions at $\sqrt{s} = 7$ TeV with ALICE at the LHC. Electrons were measured in the transverse momentum range 0.5 < $\pt$ < 8 GeV/c. Predictions from a fixed order perturbative QCD calculation with next-to-leading-log resummation agree with the data within the theoretical and experimental uncertainties.
Phys. Rev. D 86 (2012) 112007
HEP Data
e-Print: arXiv:1205.5423 | PDF | inSPIRE
CERN-PH-EP-2012-131
Figure 1
Schematic beam view at $z = 0$ of the ALICE central barrel detectors during the 2010 running period of the LHC. The detectors used in the present analysis are the Inner Tracking System (ITS), the Time Projection Chamber (TPC), the Transition Radiation Detector (TRD), the Time-Of-Flight Detector (TOF), and the Electromagnetic Calorimeter (EMCal). | 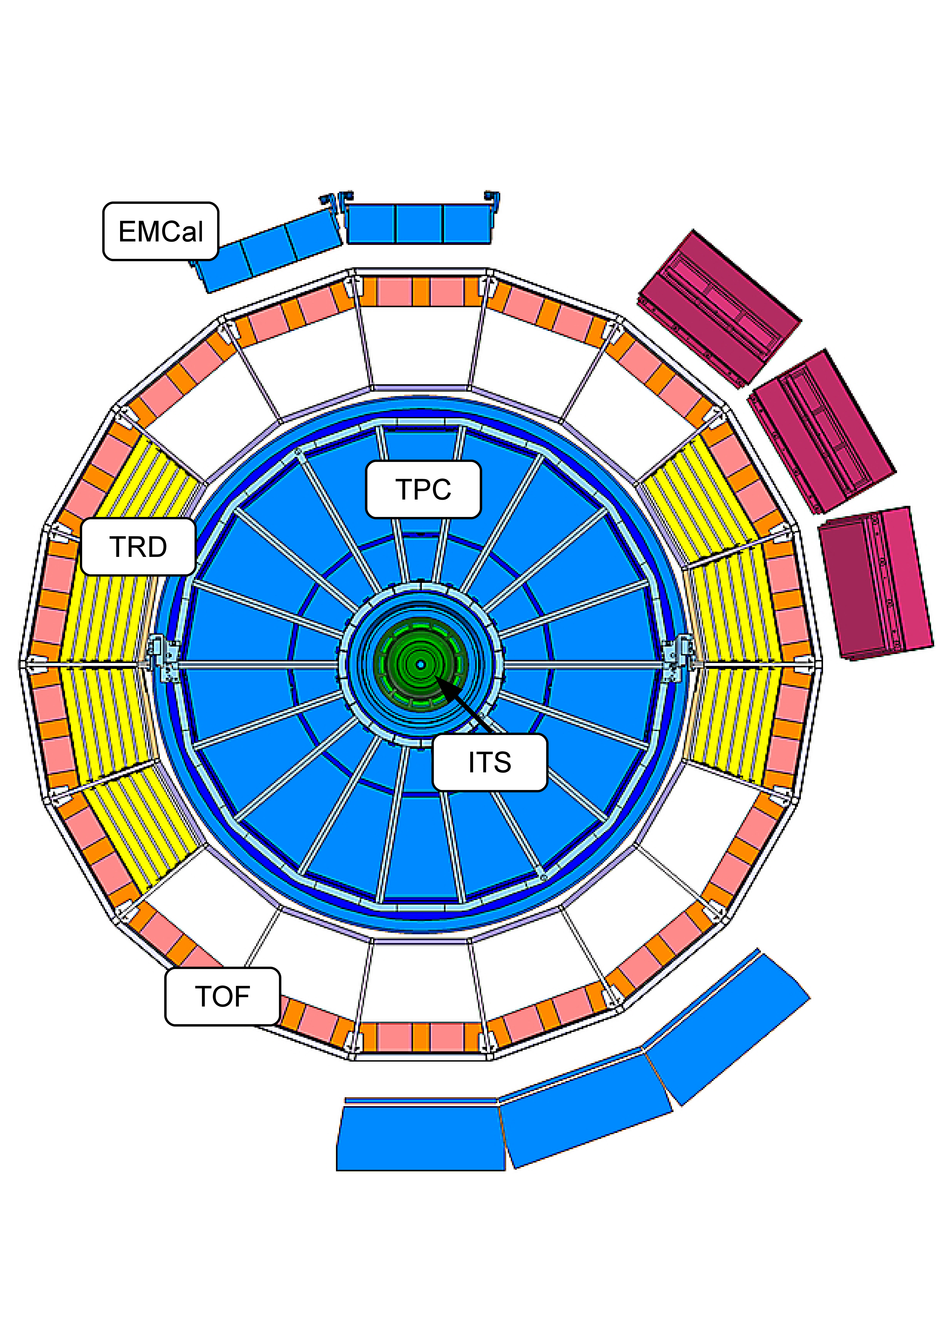 |
Figure 2
Specific energy loss $d$E/d$x$ in arbitrary units measured in the TPC as a function of the reconstructed charged particle momentum(left panel), and expressed as a deviation from the expected energy loss of electrons, normalised by the energy loss resolution (right panel). Contributions from both positively and negatively charged particles are included. | 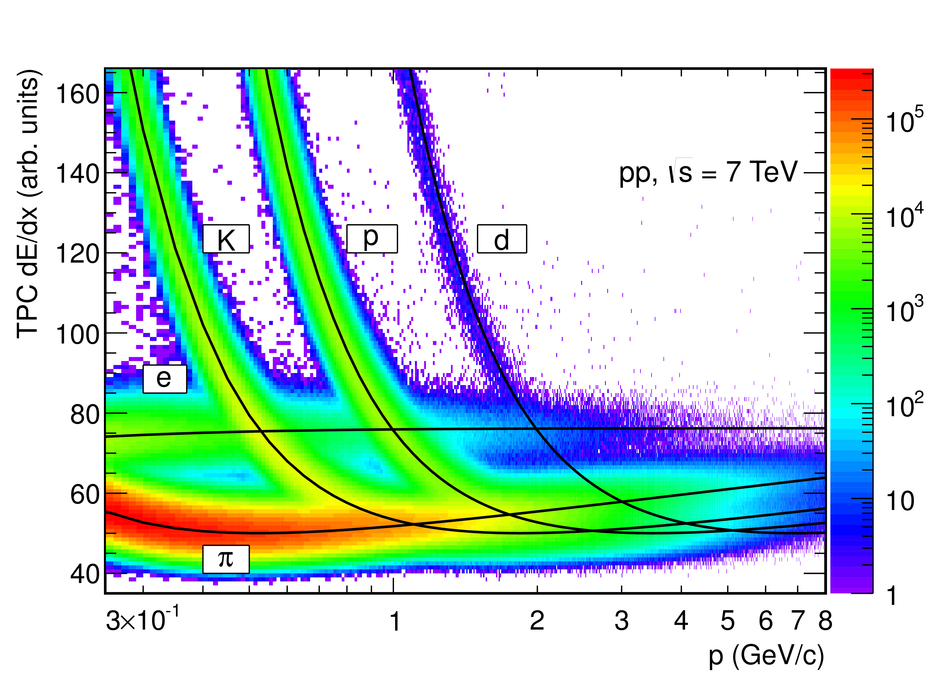 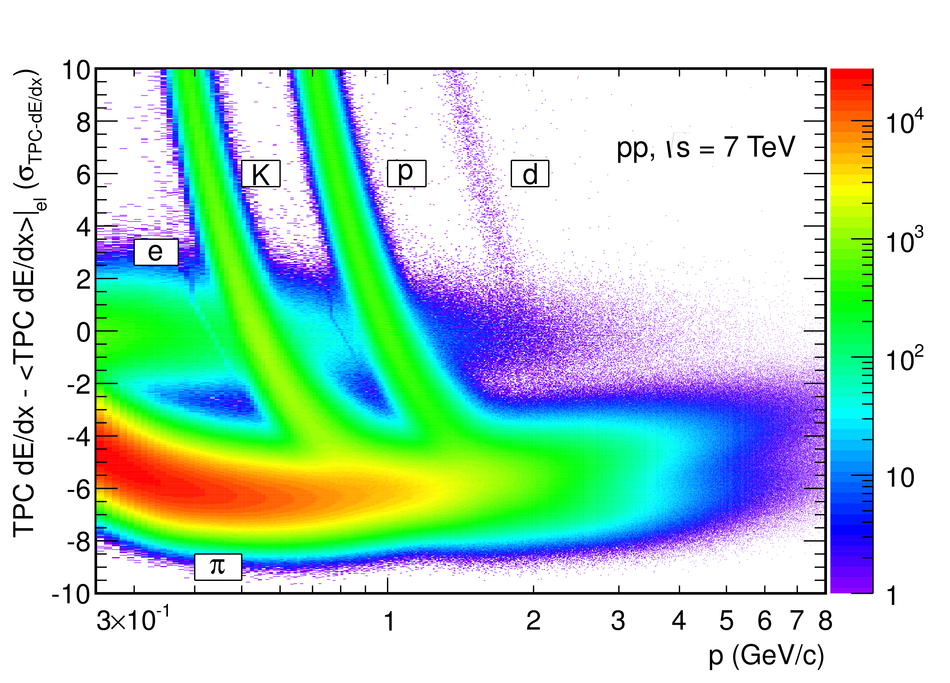 |
Figure 3
Electron selection with the TOF, TRD, and TPC detectors The difference between measured and expected time-of-flight is shown in the upper left panel. Lines indicate the selection band. For tracks selected by TOF,the TRD electron likelihood distribution for tracks with 6 TRD tracklets isshown in the upper right panel. The lower right panel displays the TRD electron likelihood distribution for tracks with an electron efficiency of 80% in the TRD (note the compressed scale on the vertical axis). For tracks passing the TRD selection, the TPC d$E$/d$x$, expressed in units of the d$E$/d$x$ resolution($\sigma_{\rm{TPC}-\rm{d}\mathit{E}/\rm{d}\mathit{x}}$) is shown in the lower left panel. Lines indicate the electron selection band. The parameterisation of the expected energy loss of electronsin this data period, and the specific selection criteria of this analysis are such that the mean (width) of the electron d$E$/d$x$ distribution is not exactly zero (one). Therefore, the selection band is slightly shifted from the nominal values of 0 and 3 $\sigma_{\rm{TPC}-\rm{d}\mathit{E}/\rm{d}\mathit{x}}$. |  |
Figure 4
Ratio $E/p$ of the energy deposit in the EMCal and themeasured momentum for charged particle tracks in the range $4 < \pt < 5$ GeV/c. The distribution was fitted with the sum of aGaussian for the electron signal and an exponential for the remaining hadronbackground. Arrows indicate the selection window for electron candidates. | 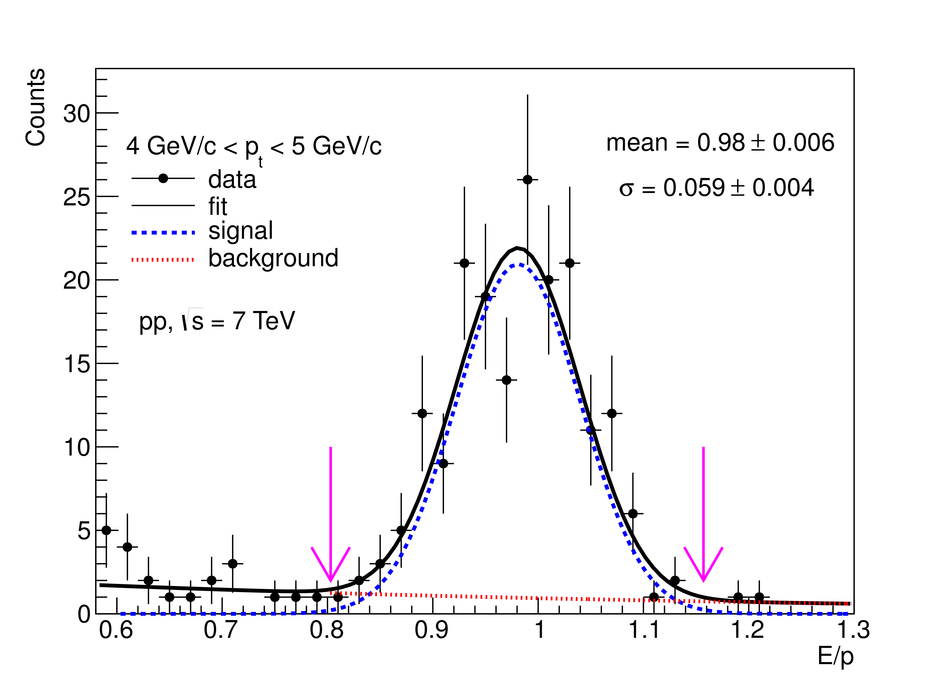 |
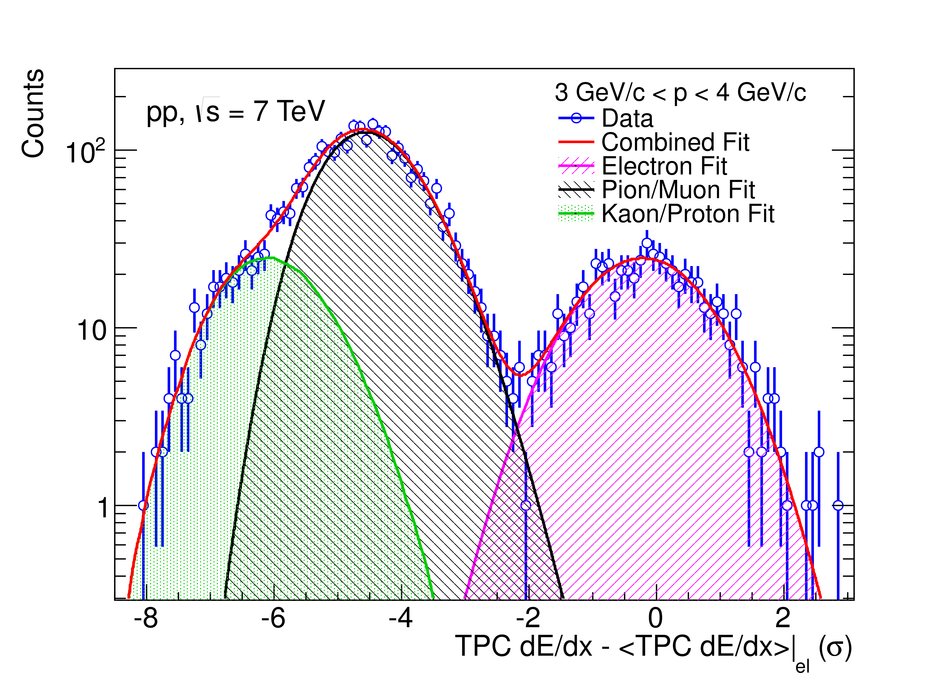
Figure 6
Acceptance, tracking, and particle identification efficiency for electrons at mid-rapidity in pp collisions at 7 TeV for the TPC-TOF/TPC-TRD-TOF and the TPC-EMCal analysis. For transverse momenta below 4 GeV/c the TRD was not used for eID. The total reconstruction efficiency for electrons with the TPC-TRD-TOF eID approach is shown for the requirement of 6 tracklets in the TRD as an example. | 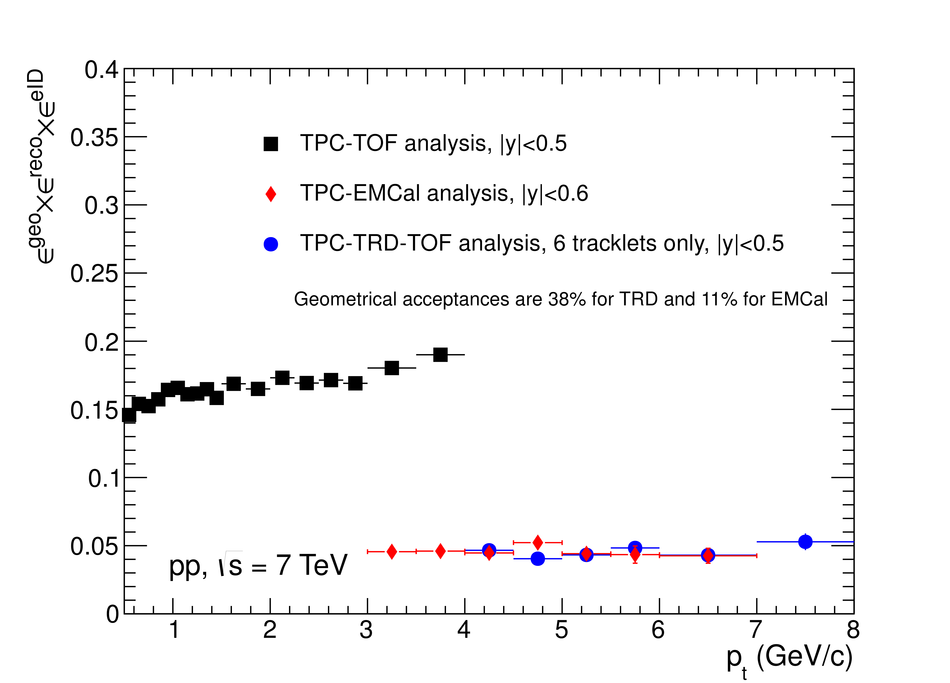 |
Figure 7
Acceptance, tracking, and particle identification efficiencies are compared in data and in simulation for electrons from photon conversions in material. Upper panel: TRD acceptance times tracking efficiency (at least five reconstructed tracklets were required for this example). For transverse momenta below 4 GeV/c the TRD was not used for eID. Lower panel:TOF matching efficiency times particle identification efficiency | 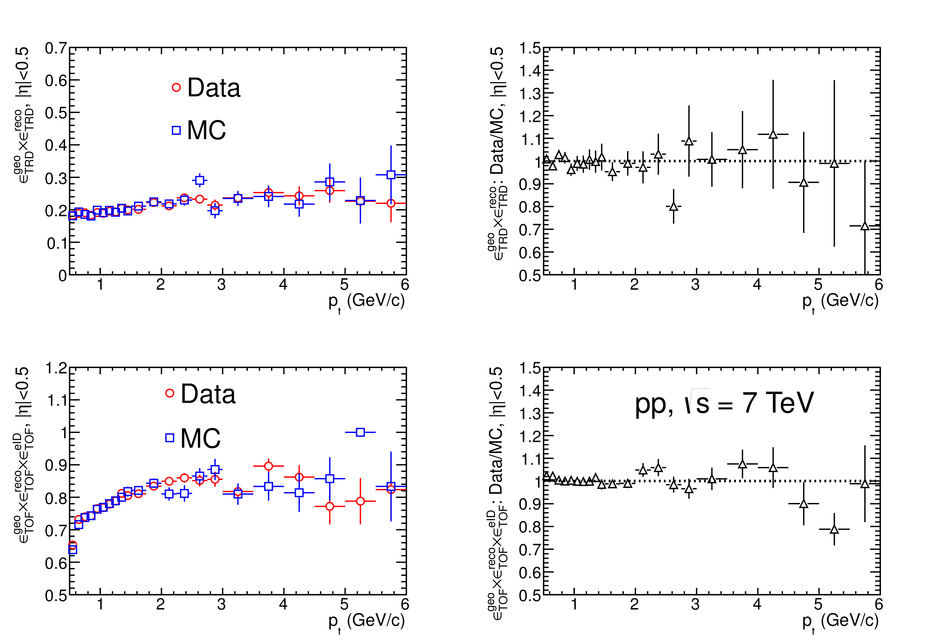 |
Figure 8
Inclusive electron yield per minimum bias collisionas function of \pt measured at mid-rapidity showing the TPC-TOF, TPC-TRD-TOF,and TPC-EMCal results, respectively, in pp collisions at $\sqrt{s} = 7$ TeV. The TPC-TOF and TPC-TRD-TOF spectra have been parameterised simultaneously using a Tsallis function (upper panel) The ratio of the measured spectra to the Tsallis fit is shown in the lower panel. Statistical uncertainties are indicated by error bars, while systematic uncertainties are shown as boxes. |  |
Figure 9
Invariant differential production cross sections for neutral pions and $\eta$ mesons in pp collision at $\sqrt{s} = 7$ TeV as function of $\pt$ [56] together with fits using Eq.2 (left panel). Ratios of the measured $\pi^0$ and $\eta$ spectra to the fits (right panel). In both panels the error bars depict the combined statistical and systematic uncertainties of the neutral meson data. \begin{align*} &(2)& E \frac{{\rm d}^3\sigma}{{\rm d}p^3} = \frac{\sigma_{\rm pp}}{2\pi}\frac{{\rm d}N}{{\rm d}y}\frac{(n-1)(n-2)}{nT(nT+m(n-2))} (1+(m_{\rm t}-m)/(nT))^{-n} \end{align*} | 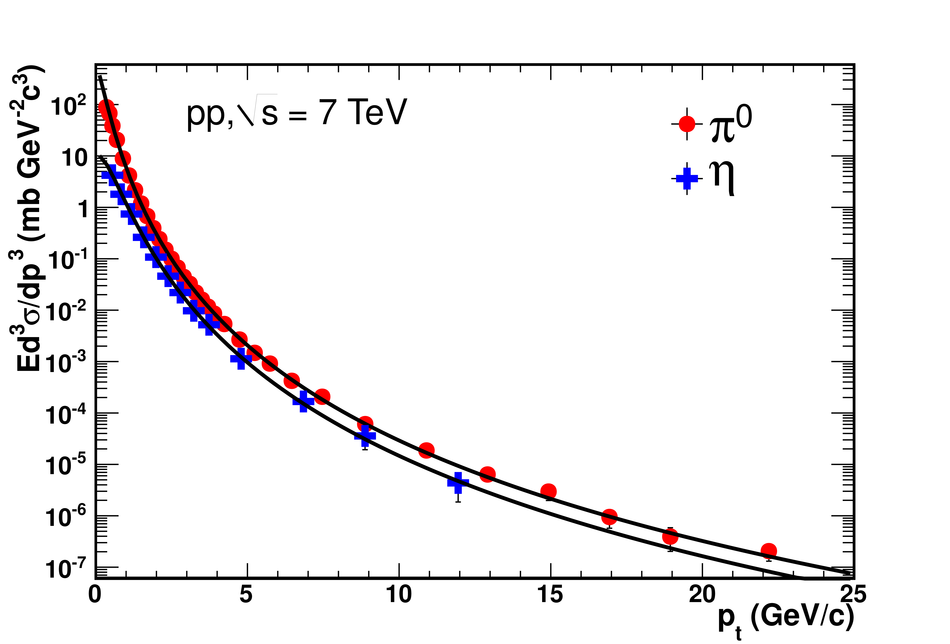 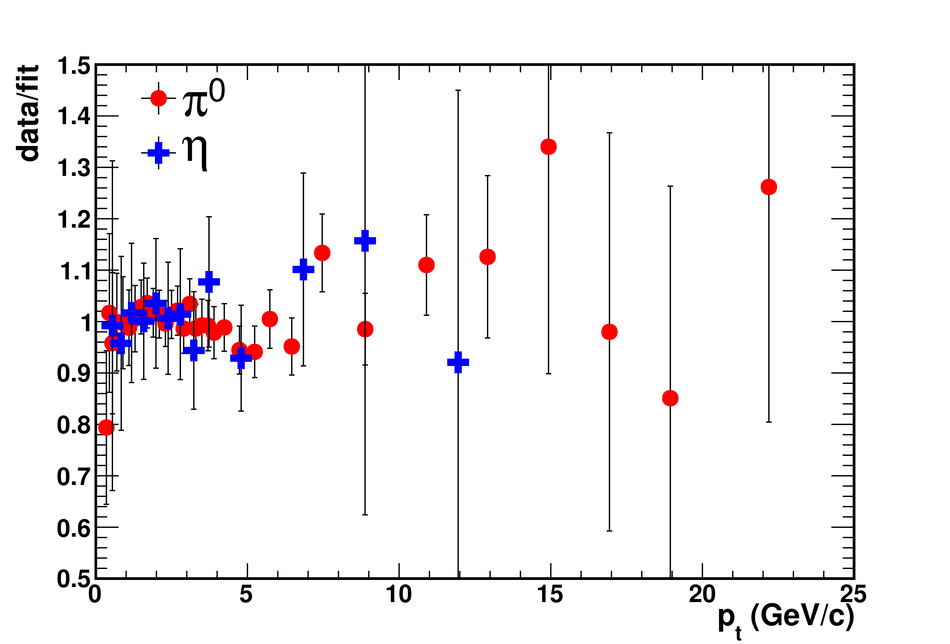 |
Figure 10
Inclusive electron yield per minimum bias pp collision as function of $\pt$ at $\sqrt{s} = 7$ TeV in comparison with background electron cocktails for the TPC-TOF/TPC-TRD-TOF analysis (left panel)and the TPC-EMCal analysis (right panel). Lower panels show the ratio of the inclusive electron yield to the background electron cocktail for both analyses. | 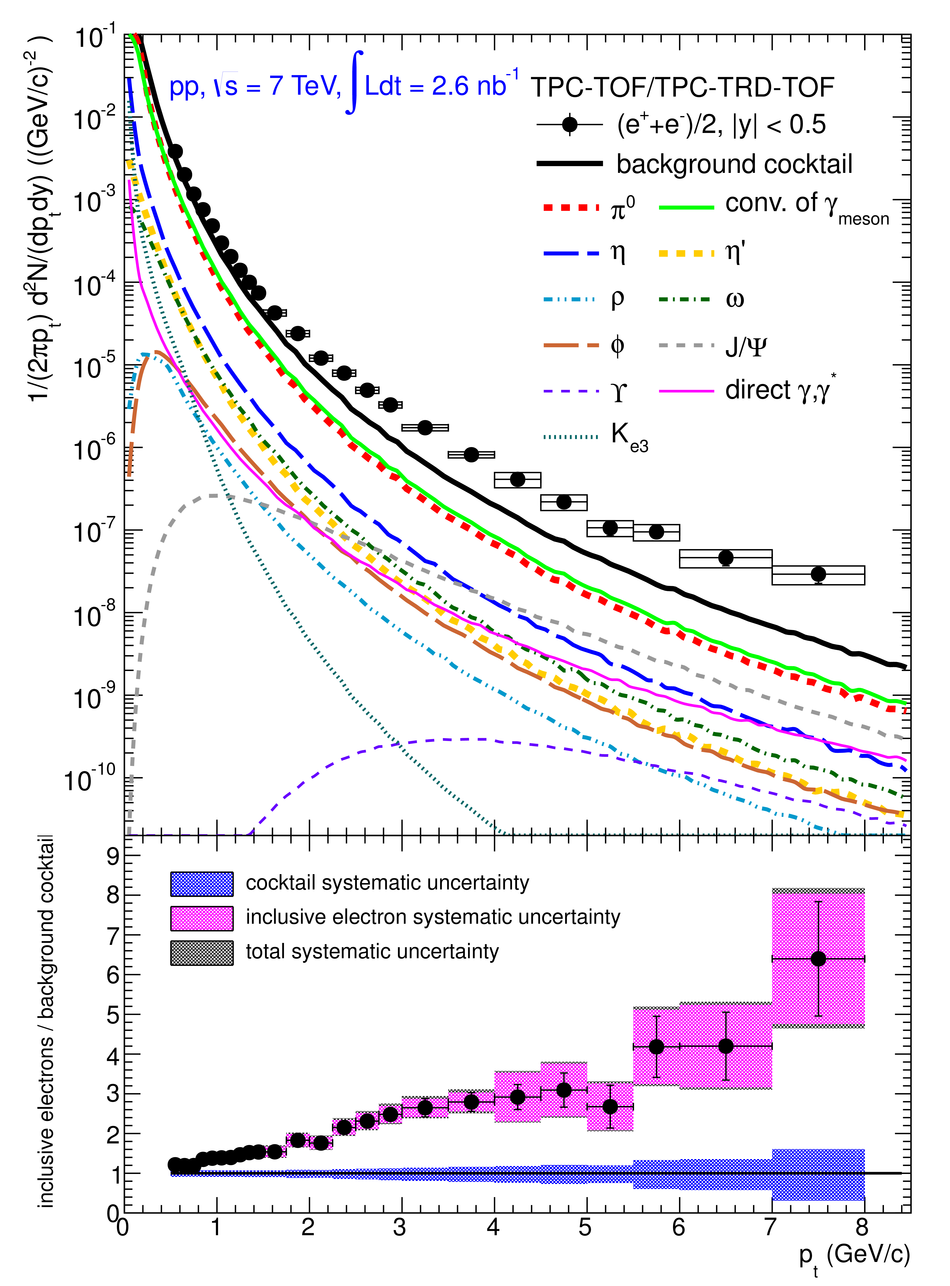 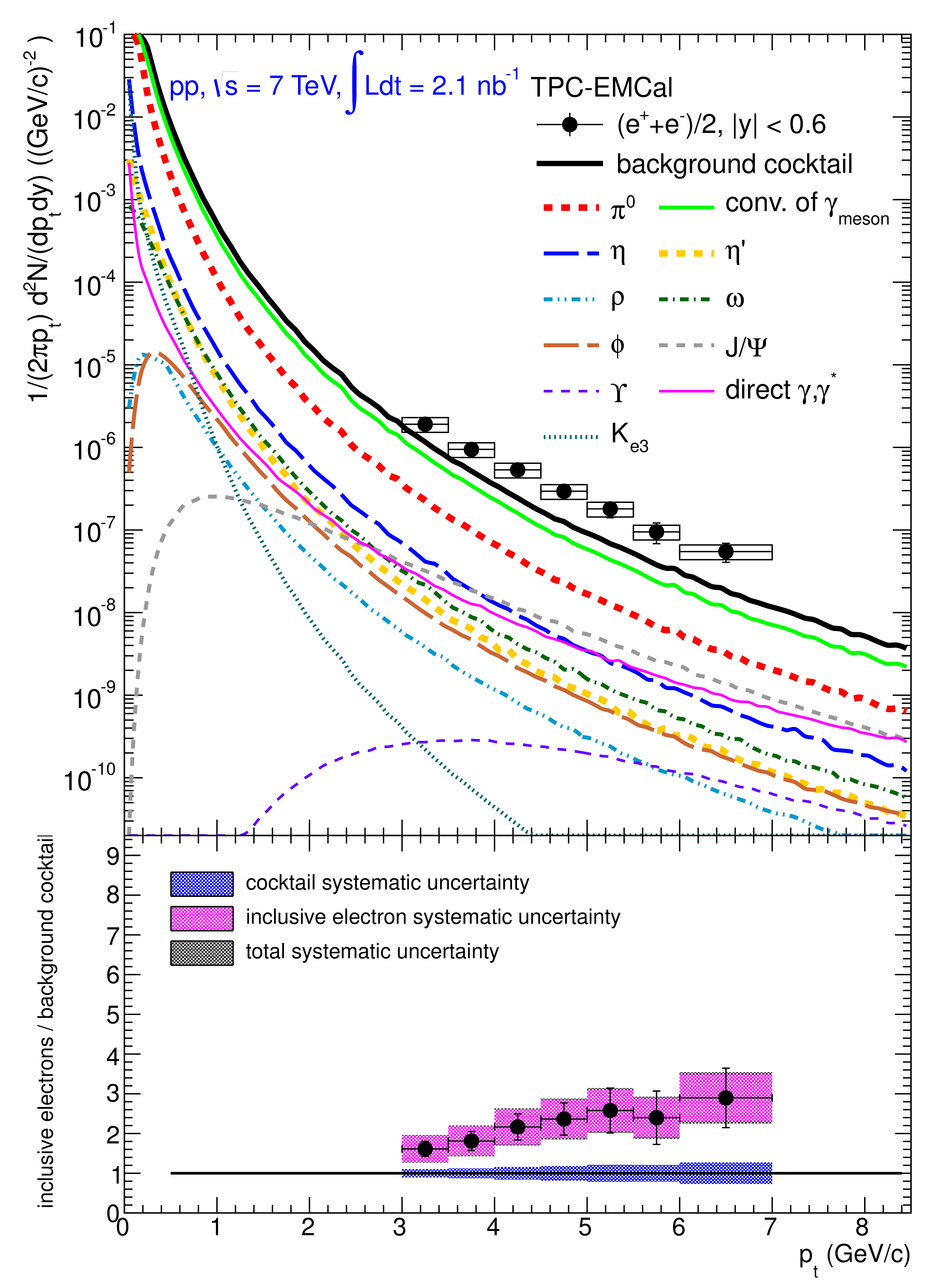 |
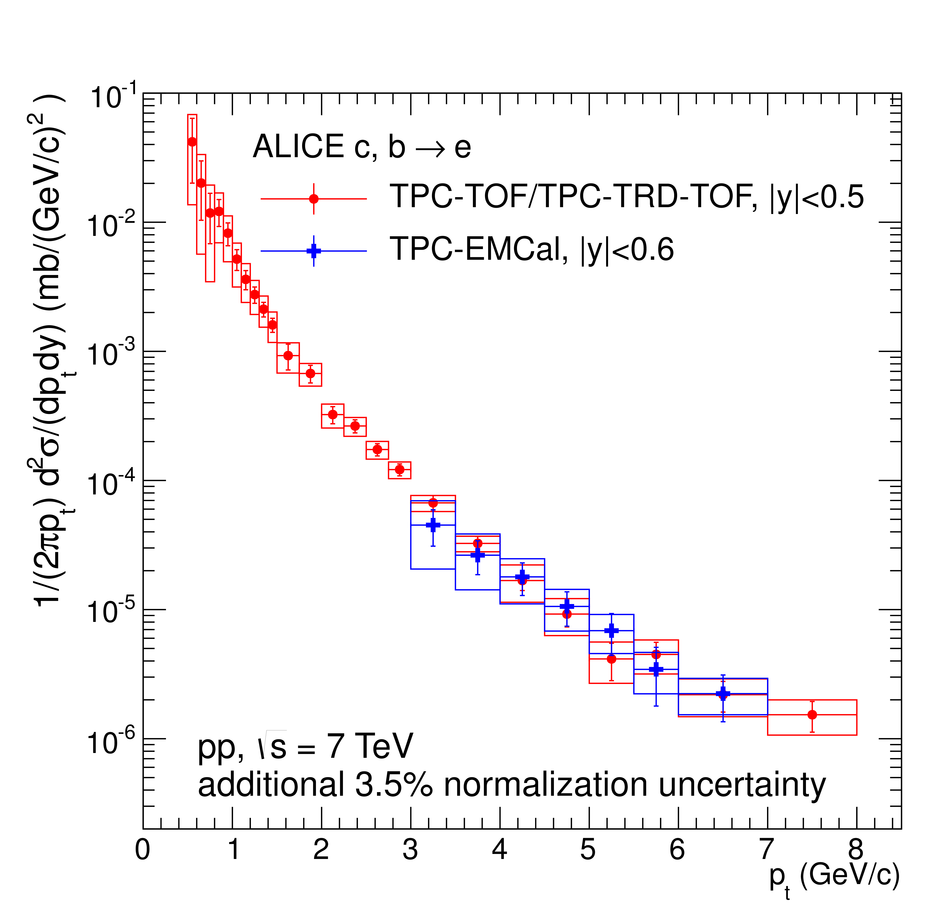
Figure 12
Production cross section ratios of electrons from heavy-flavour hadron decays and neutral pions in pp collisions measured as function of $\pt$ with ALICE at the LHC, PHENIX at RHIC [17,74-76], and the CCRS experiment at the ISR [12,77]. Error bars are statistical errors. Systematic uncertainties are depicted b yboxes (ALICE) and brackets (PHENIX). | 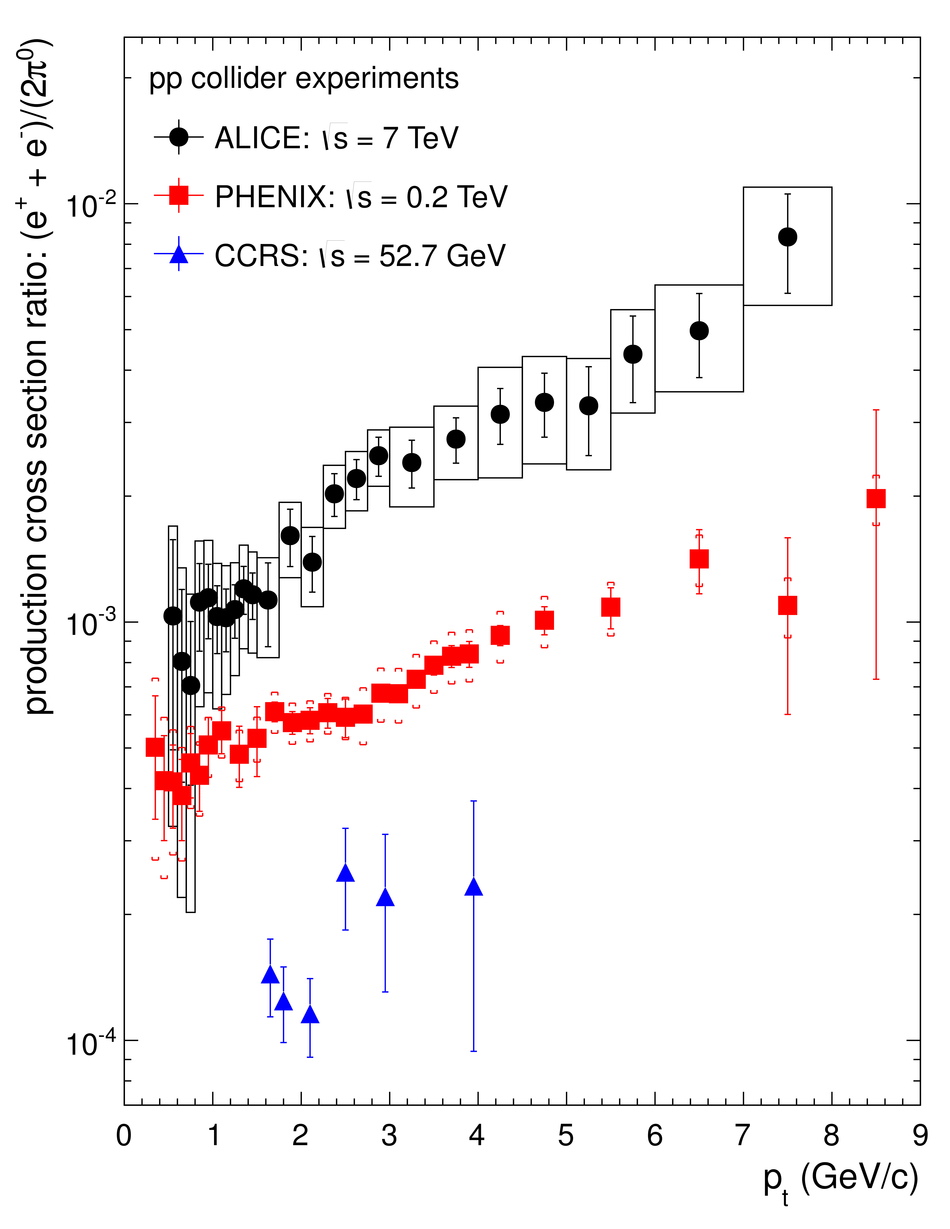 |
Figure 13
The measured electron spectrum from heavy-flavour hadron decays is compared to a FONLL calculation for inclusive charm and beauty hadron semileptonic decays on an absolute scale in the upper panel The ratio of the measured spectrum to the FONLL pQCD calculation is shown in the lower panel. Error bars, boxes, and theoretical uncertainties are described in the text. |  |
