Correlation functions versus $q_{inv}$ for identical kaons from pp collisions at $\sqrt{s}=7$ TeV (solid circles)and those obtained with PERUGIA-2011 (open circles). Positive and negative kaon pairs are combined. The three columns represent the samples with different charged-particle multiplicities: $(1-11)$, $(12-22)$, $(>22)$, the four rows represent the four pair transverse momentum ranges:(0.2-0.35), (0.35-0.5), (0.5-0.7), (0.7-1.0) GeV/$c$. The lines going through the points represent the Gaussian fits discussed in the text | 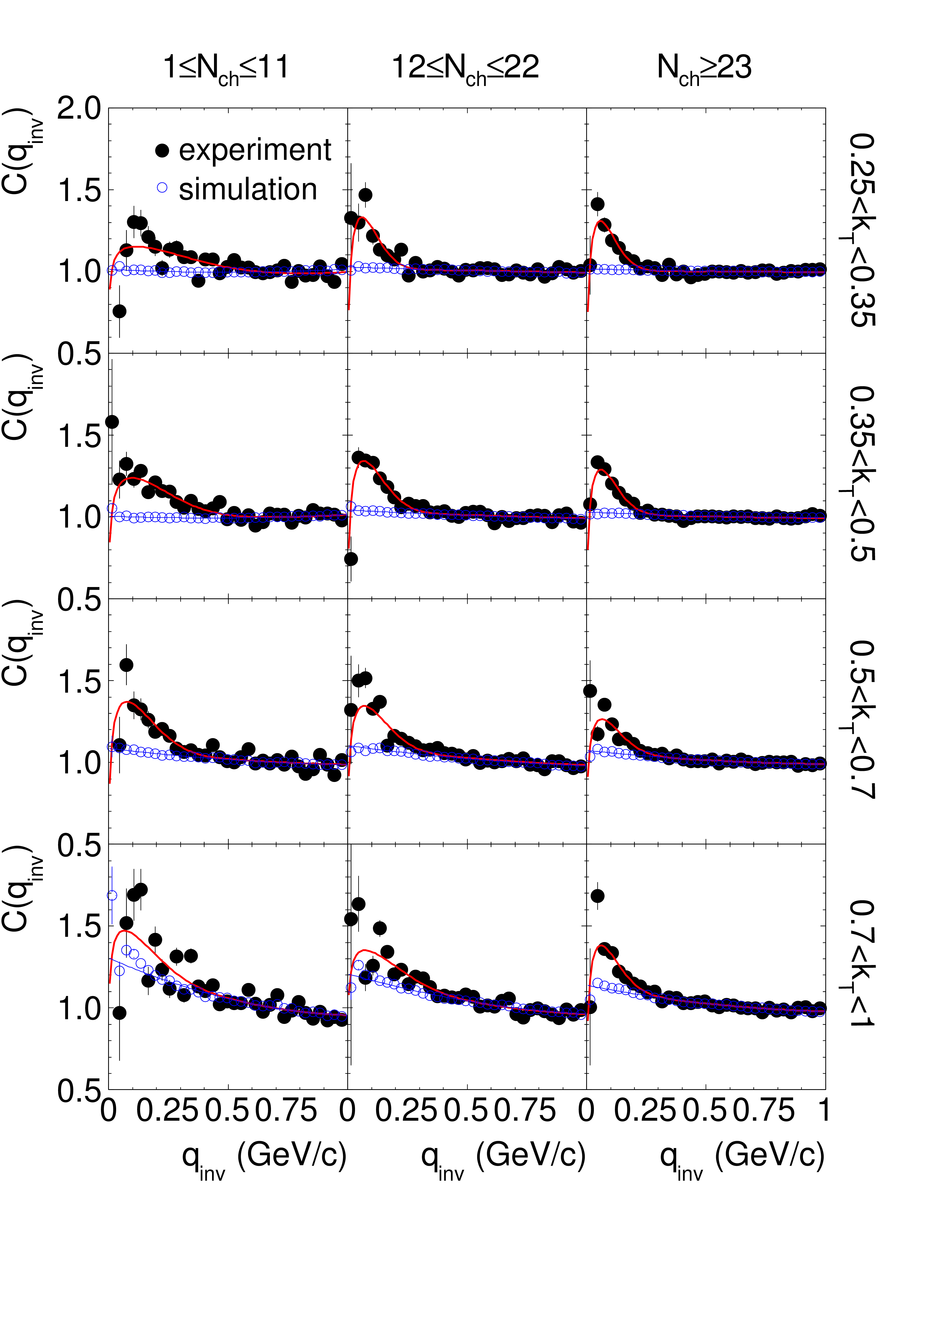 |