Same-charge four-pion full ($C_4^{\rm QS}$) correlations versus $Q_4$. Measured and expected correlations of the $1^{\rm st}$ type are shown. Dashed and solid block histograms show the $G=0$ and $G=32\%$ expected correlations, respectively. Systematic uncertainties are shown at the top. The bottom panel shows the ratio of measured to the expected $C_4^{\rm QS}$. The systematic uncertainties on the ratio are shown with a shaded blue band ($G=0$) and with a thick blue line ($G=32\%$). | 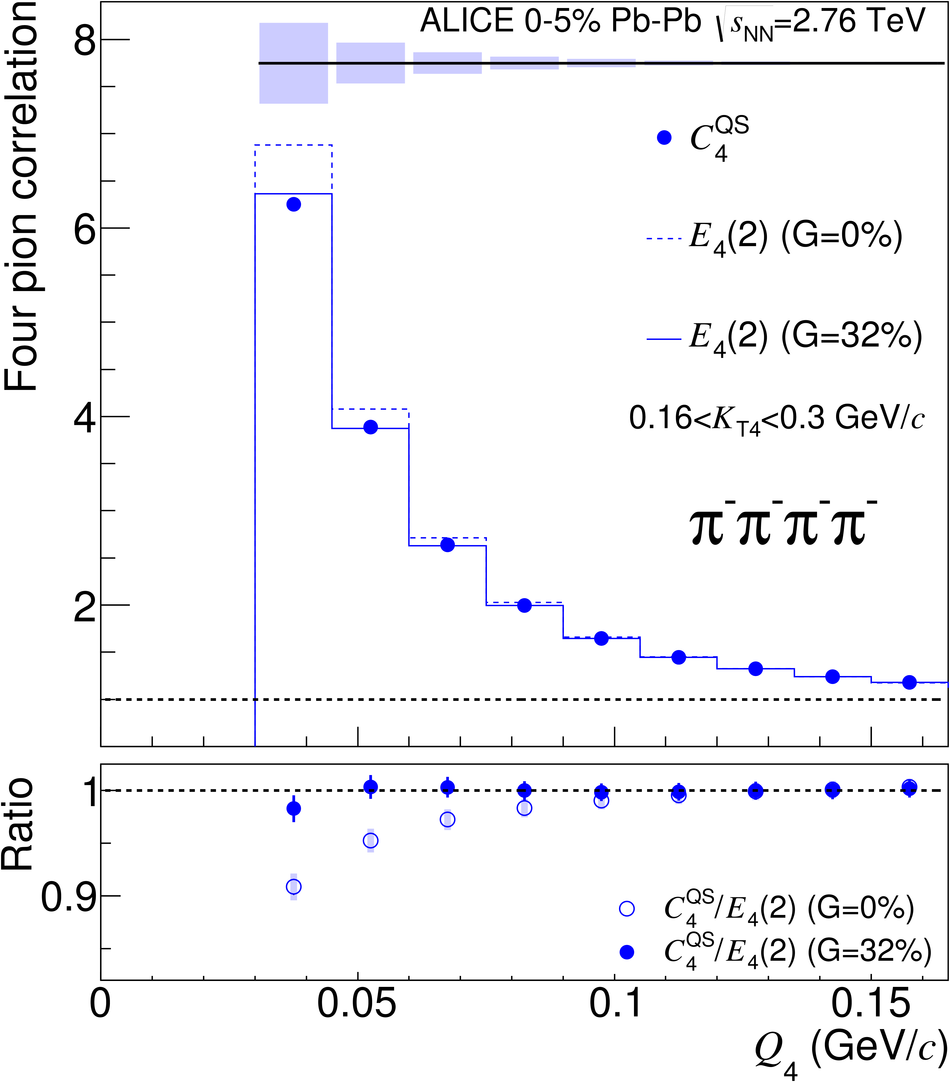 |