We present measurements of two-particle differential number correlation functions $R_{2}$ and transverse momentum correlation functions $P_{2}$, obtained from p-Pb collisions at 5.02 TeV and Pb-Pb collisions at 2.76 TeV. The results are obtained using charged particles in the pseudorapidity range $|\eta| <~$ 1.0, and transverse momentum range $0.2 <~ p_{\rm T} <~ 2.0$ GeV/$c$ as a function of pair separation in pseudorapidity, $|\Delta\eta|$, azimuthal angle, $\Delta\varphi$, and for several charged-particle multiplicity classes. Measurements are carried out for like-sign and unlike-sign charged-particle pairs separately and combined to obtain charge-independent and charge-dependent correlation functions. We study the evolution of the width of the near-side peak of these correlation functions with collision centrality. Additionally, we study Fourier decompositions of the correlators in $\Delta\varphi$ as a function of the pair separation $|\Delta\eta|$. Significant differences in the dependence of their harmonic coefficients on multiplicity classes are found. These differences can be exploited, in theoretical models, to obtain further insight into charged-particle production and transport in heavy-ion collisions. Moreover, an upper limit of non-flow contributions to flow coefficients $v_{n}$ measured in Pb-Pb collisions based on the relative strength of Fourier coefficients measured in p-Pb interactions is estimated.
Phys. Rev. C 100 (2019) 044903
e-Print: arXiv:1805.04422 | PDF | inSPIRE
CERN-EP-2018-118
Figure 1
(a) Schematic illustration of cowboy (top) and sailor (bottom) track topologies for like-sign pairs; (b) Projection of the correlator $R_{2}^{\rm (--)}$onto $\Delta\varphi$ for LS pairs in the range $|\Delta\eta|< 0.11$; and (c) in the range $0.32 \le \Delta\eta < 0.53$. | 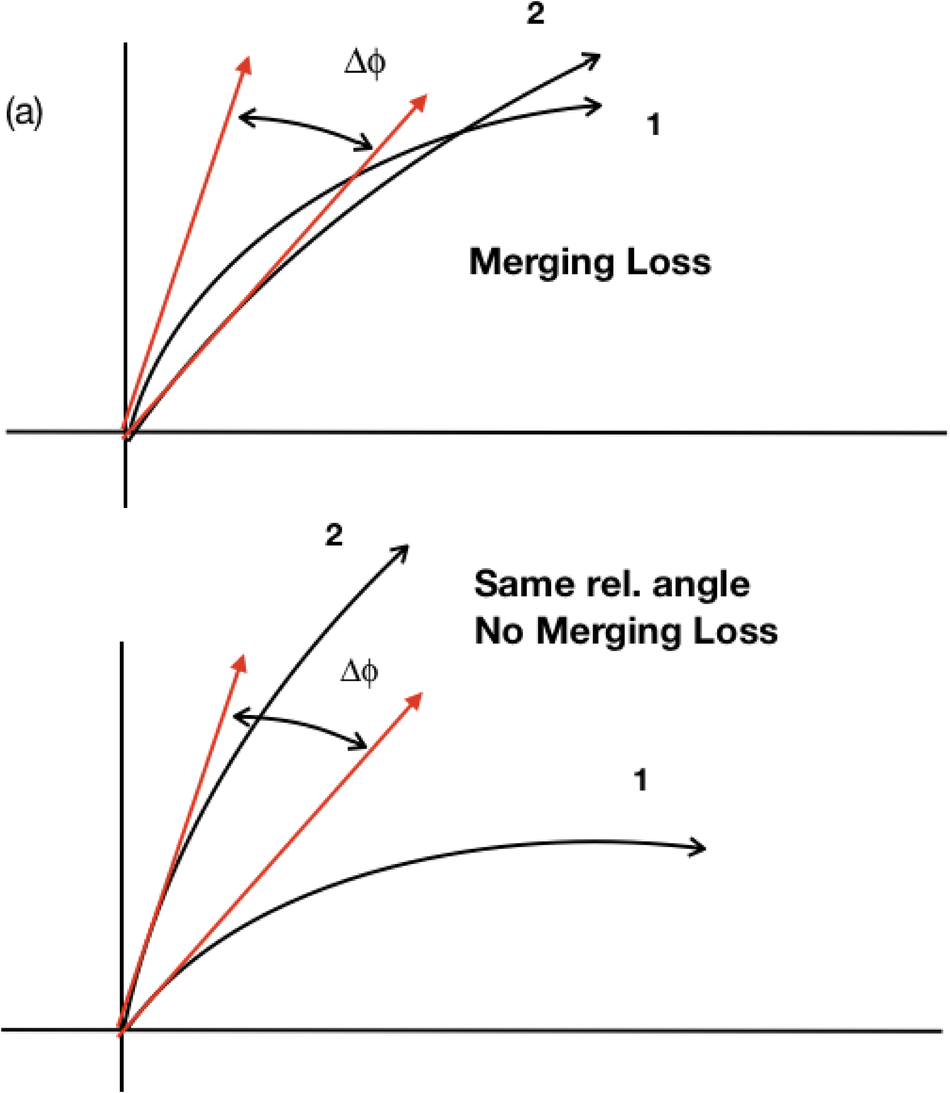 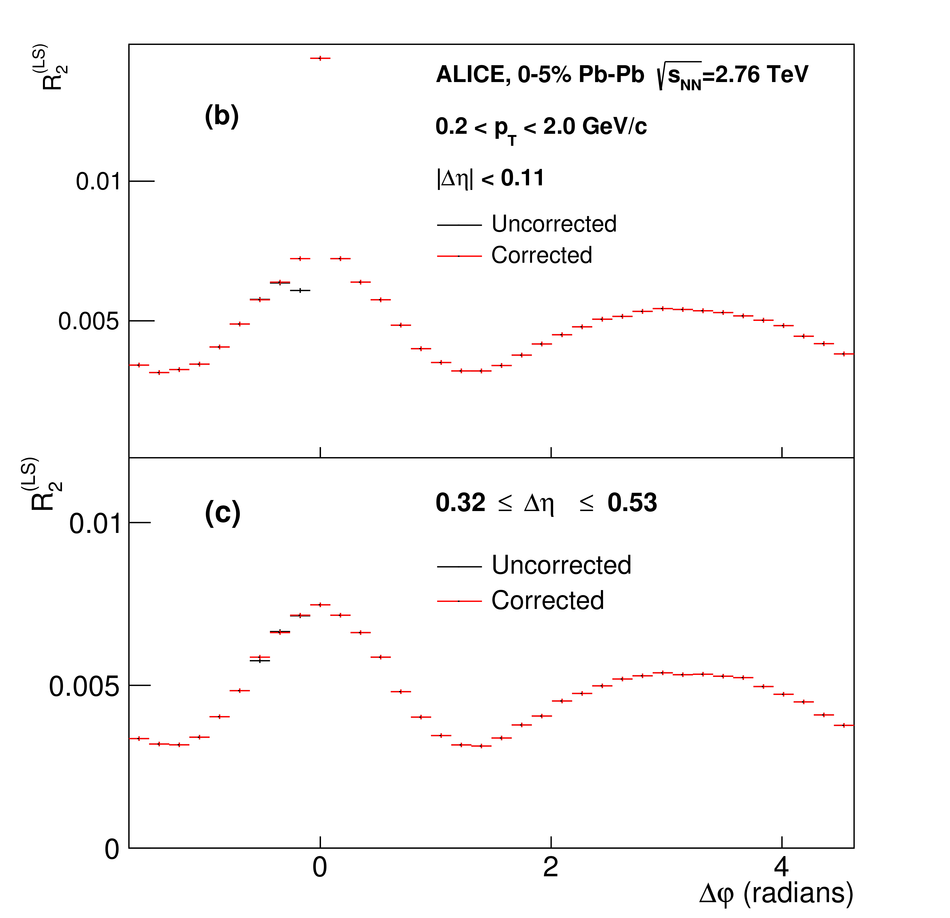 |

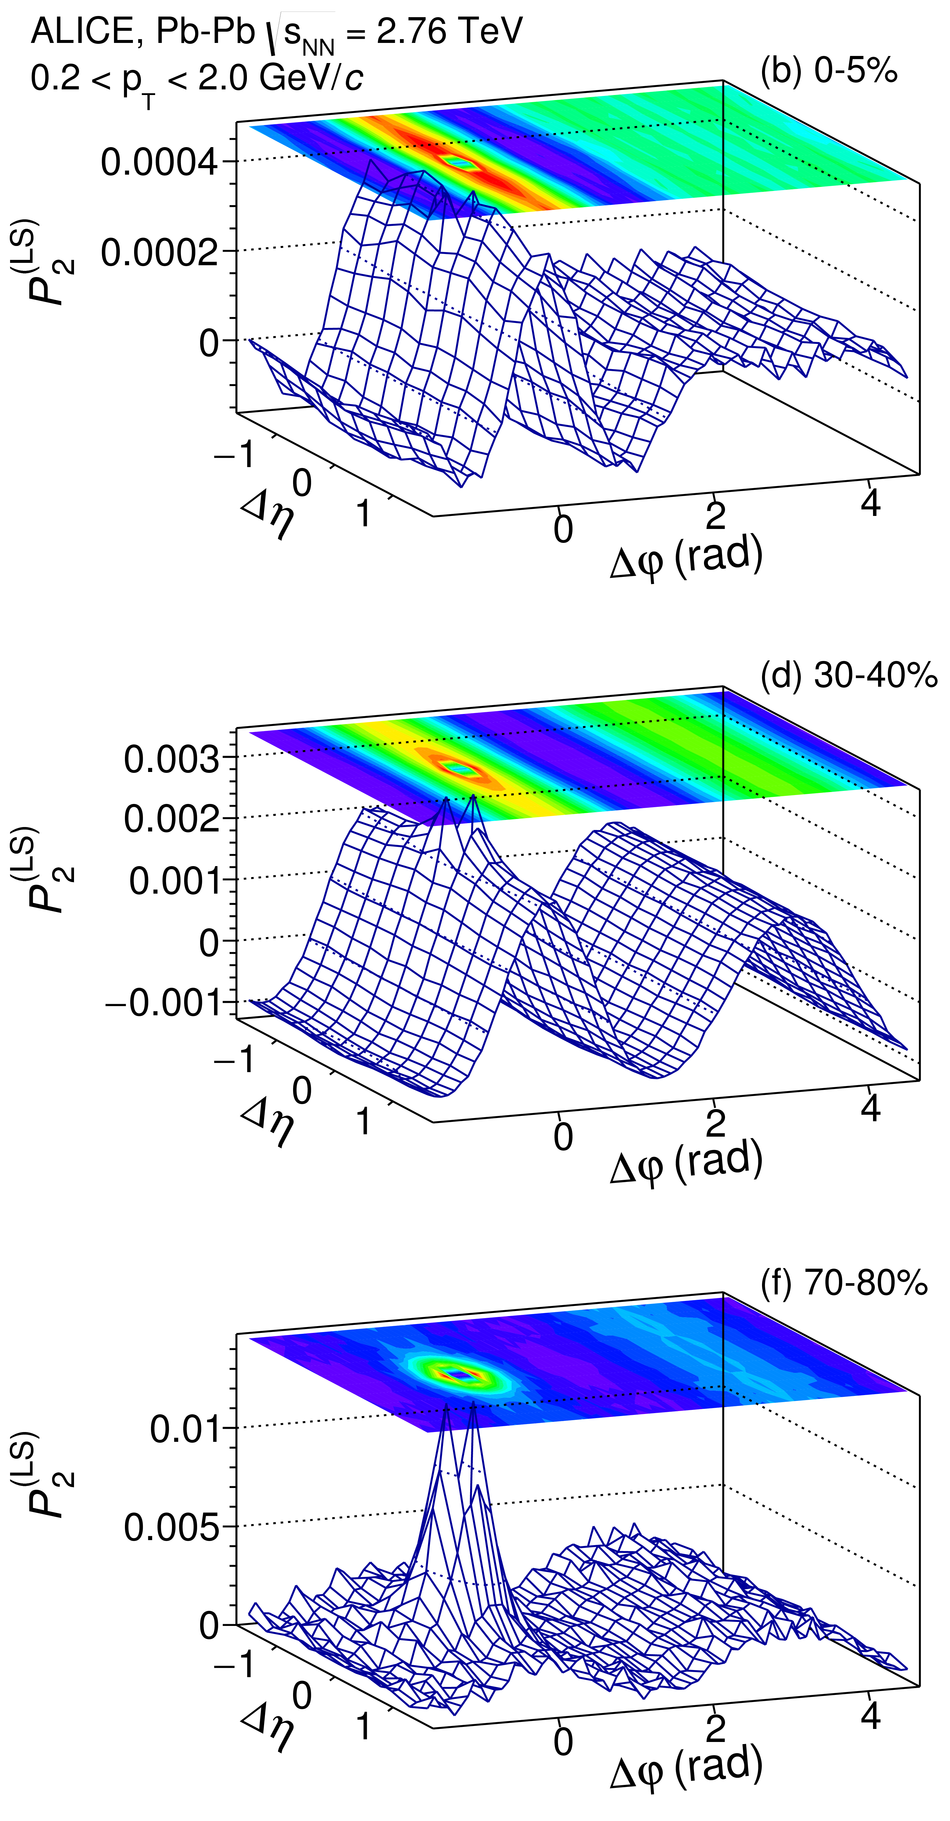
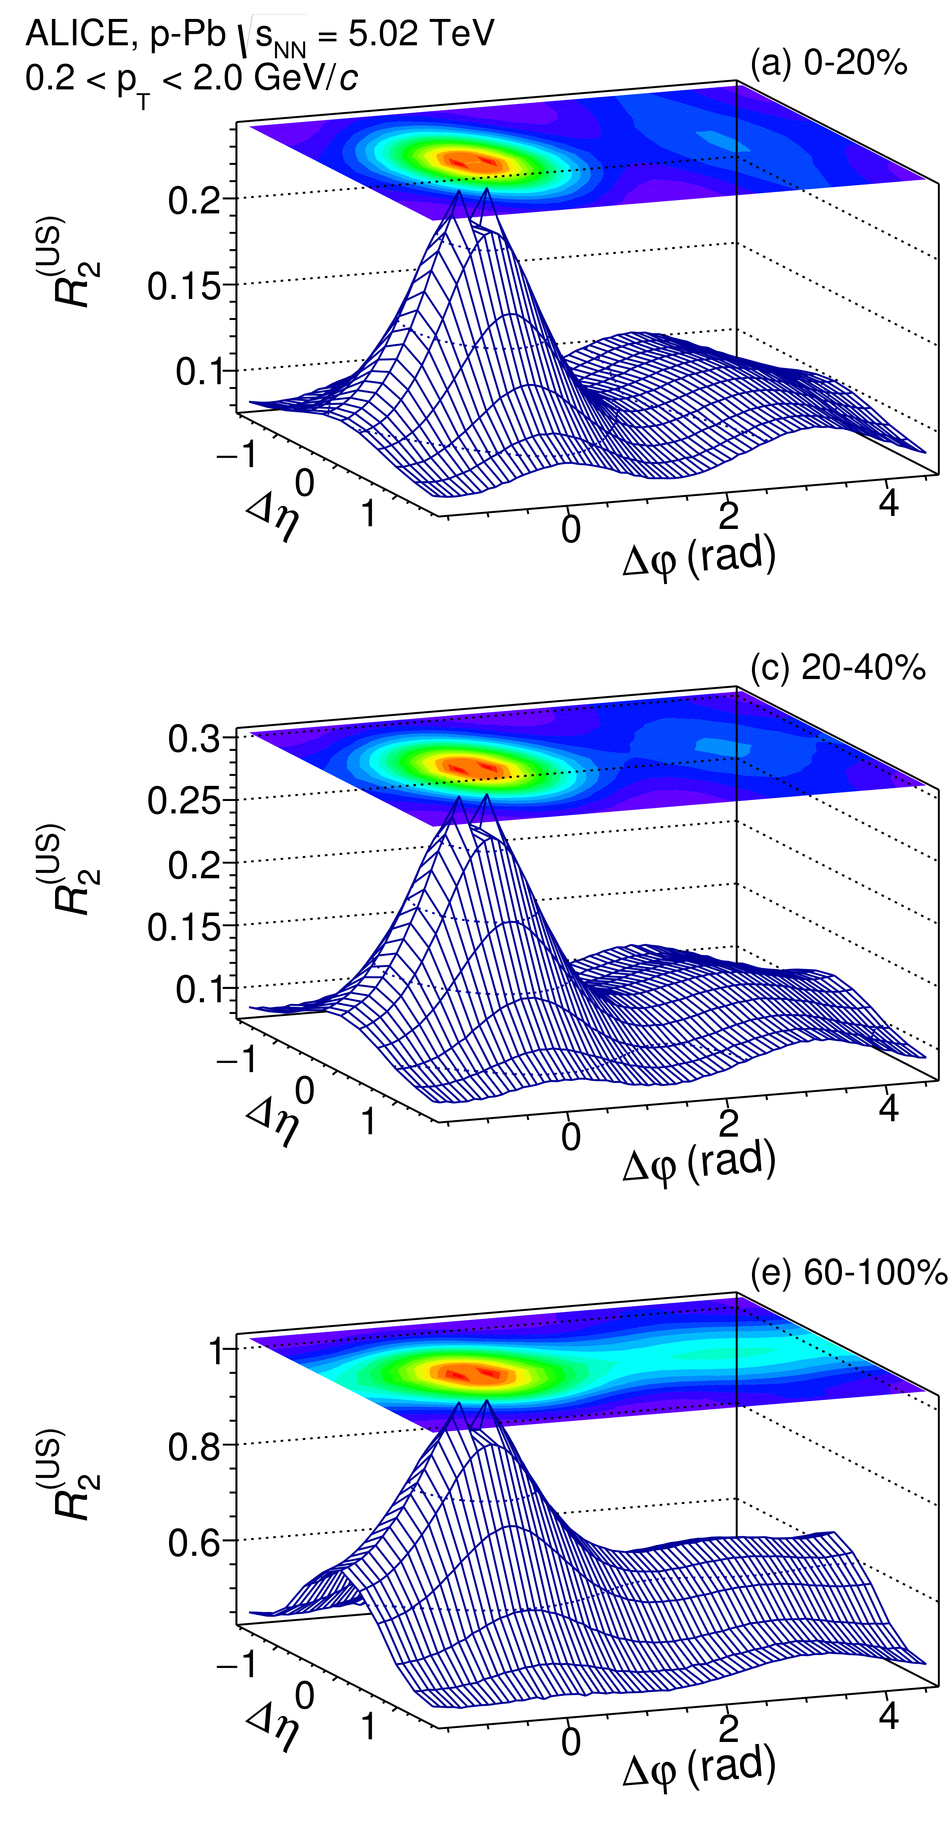
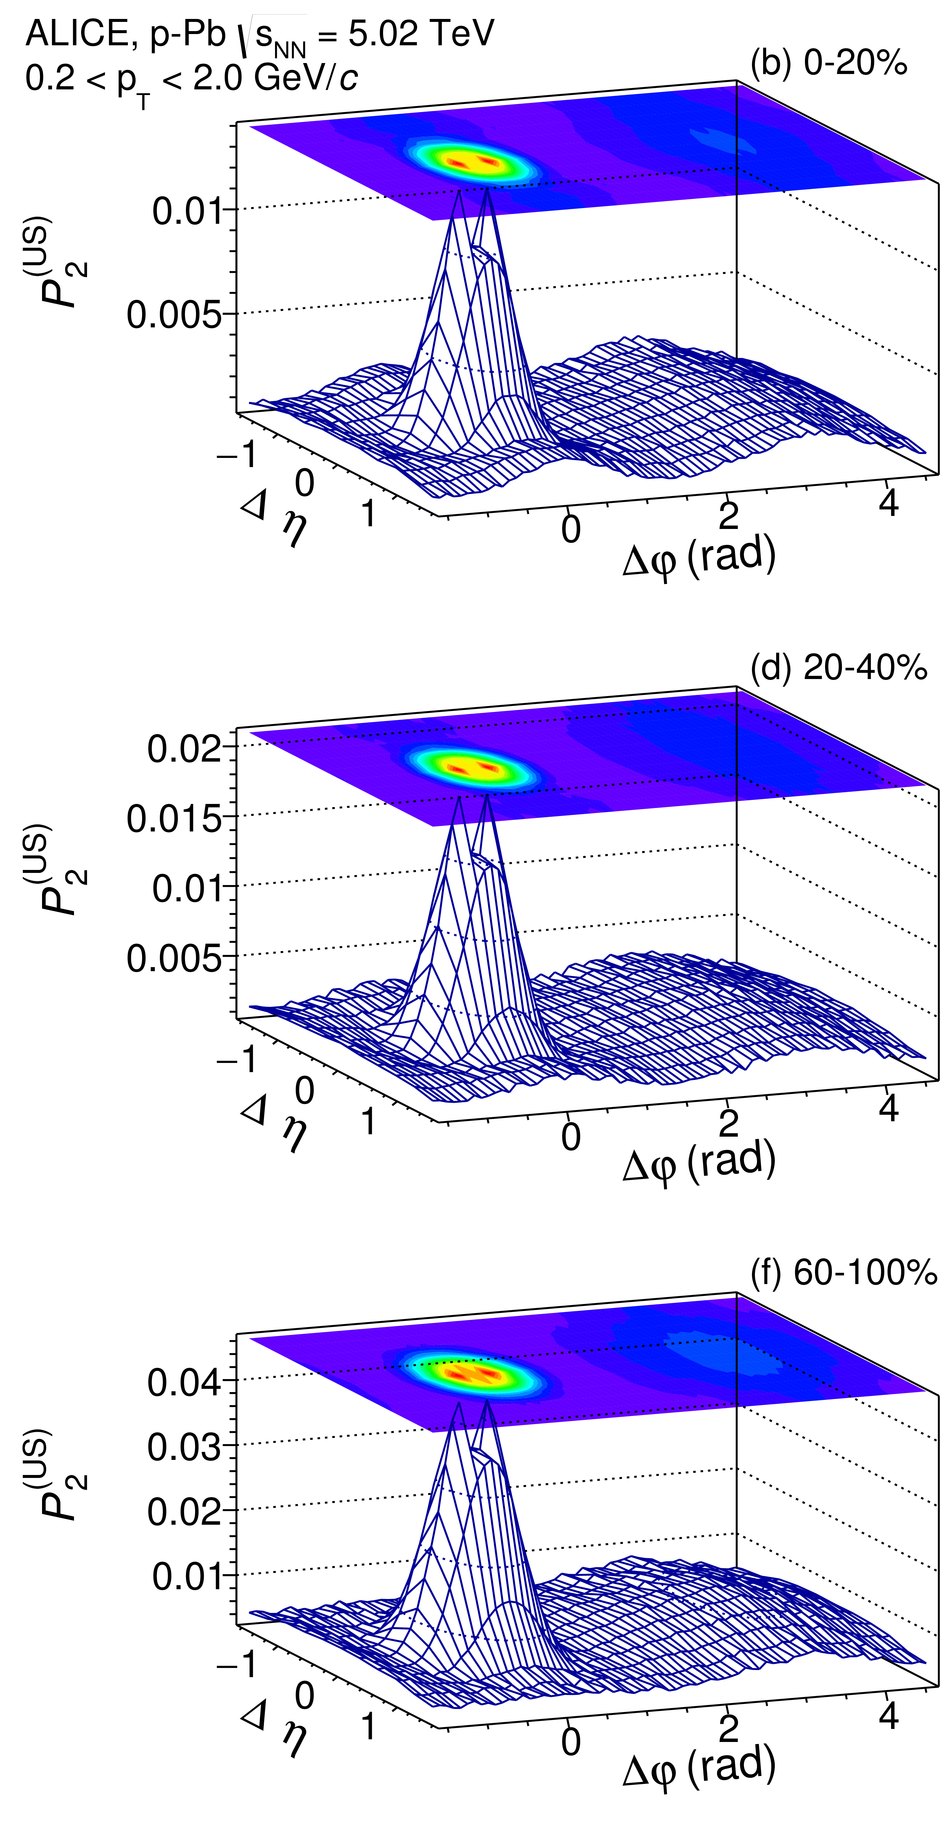
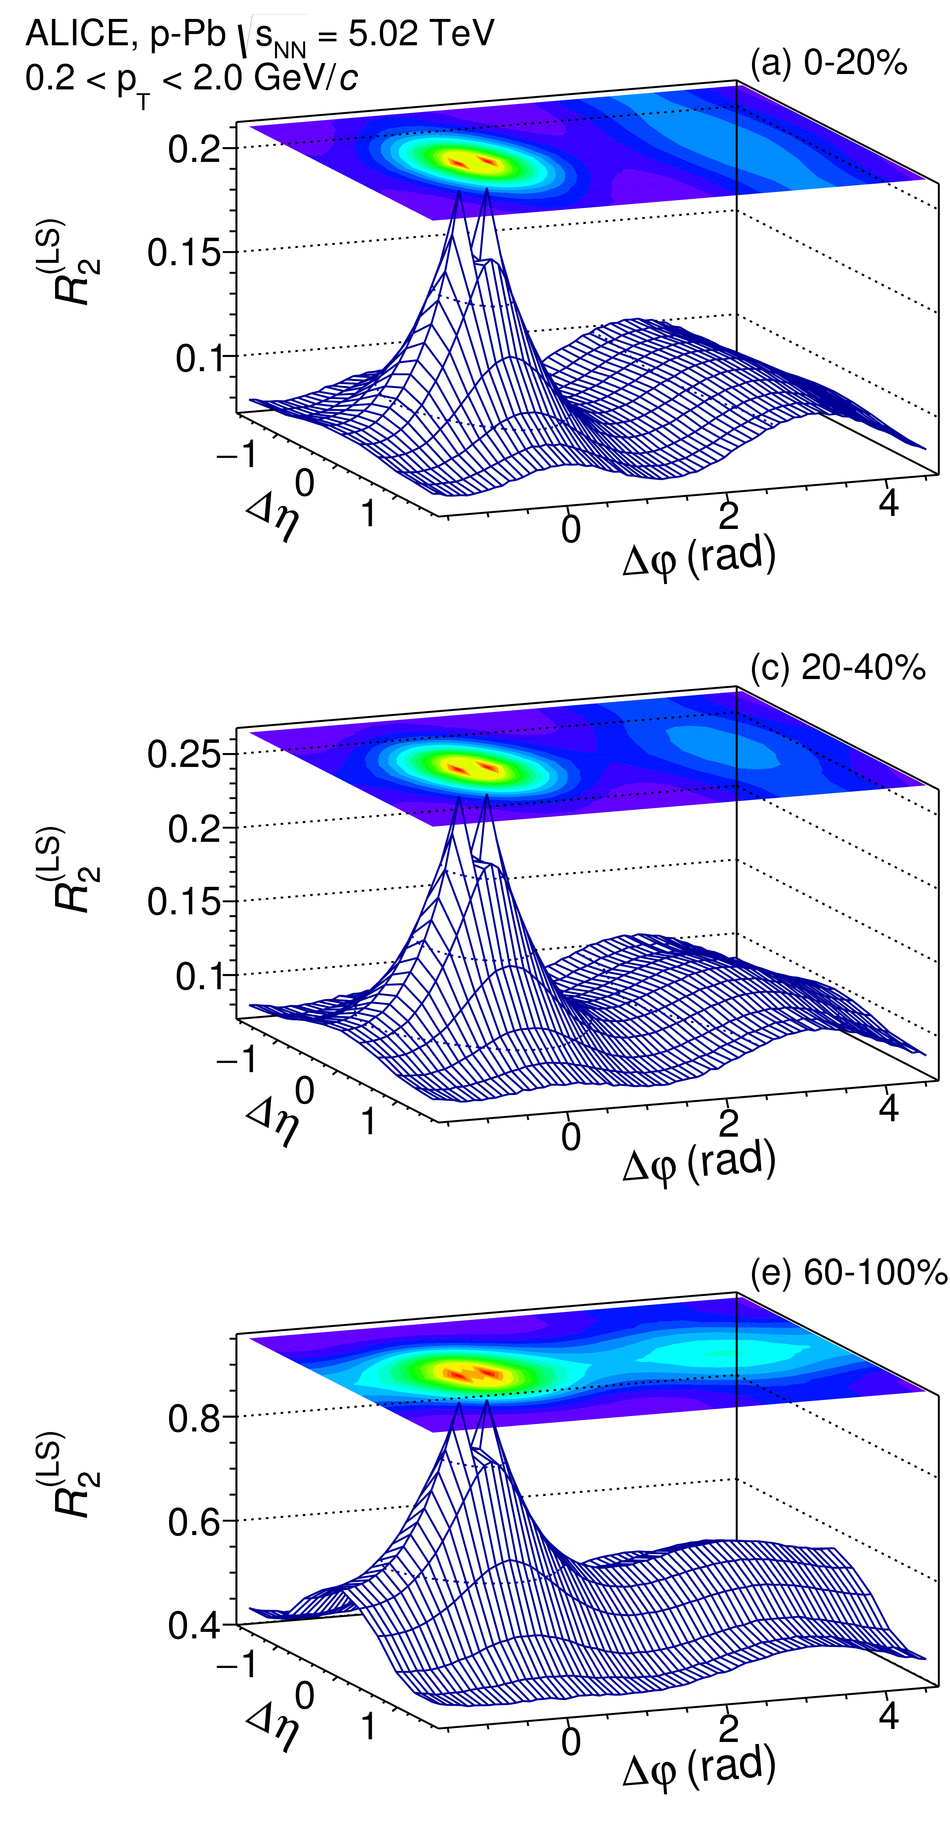
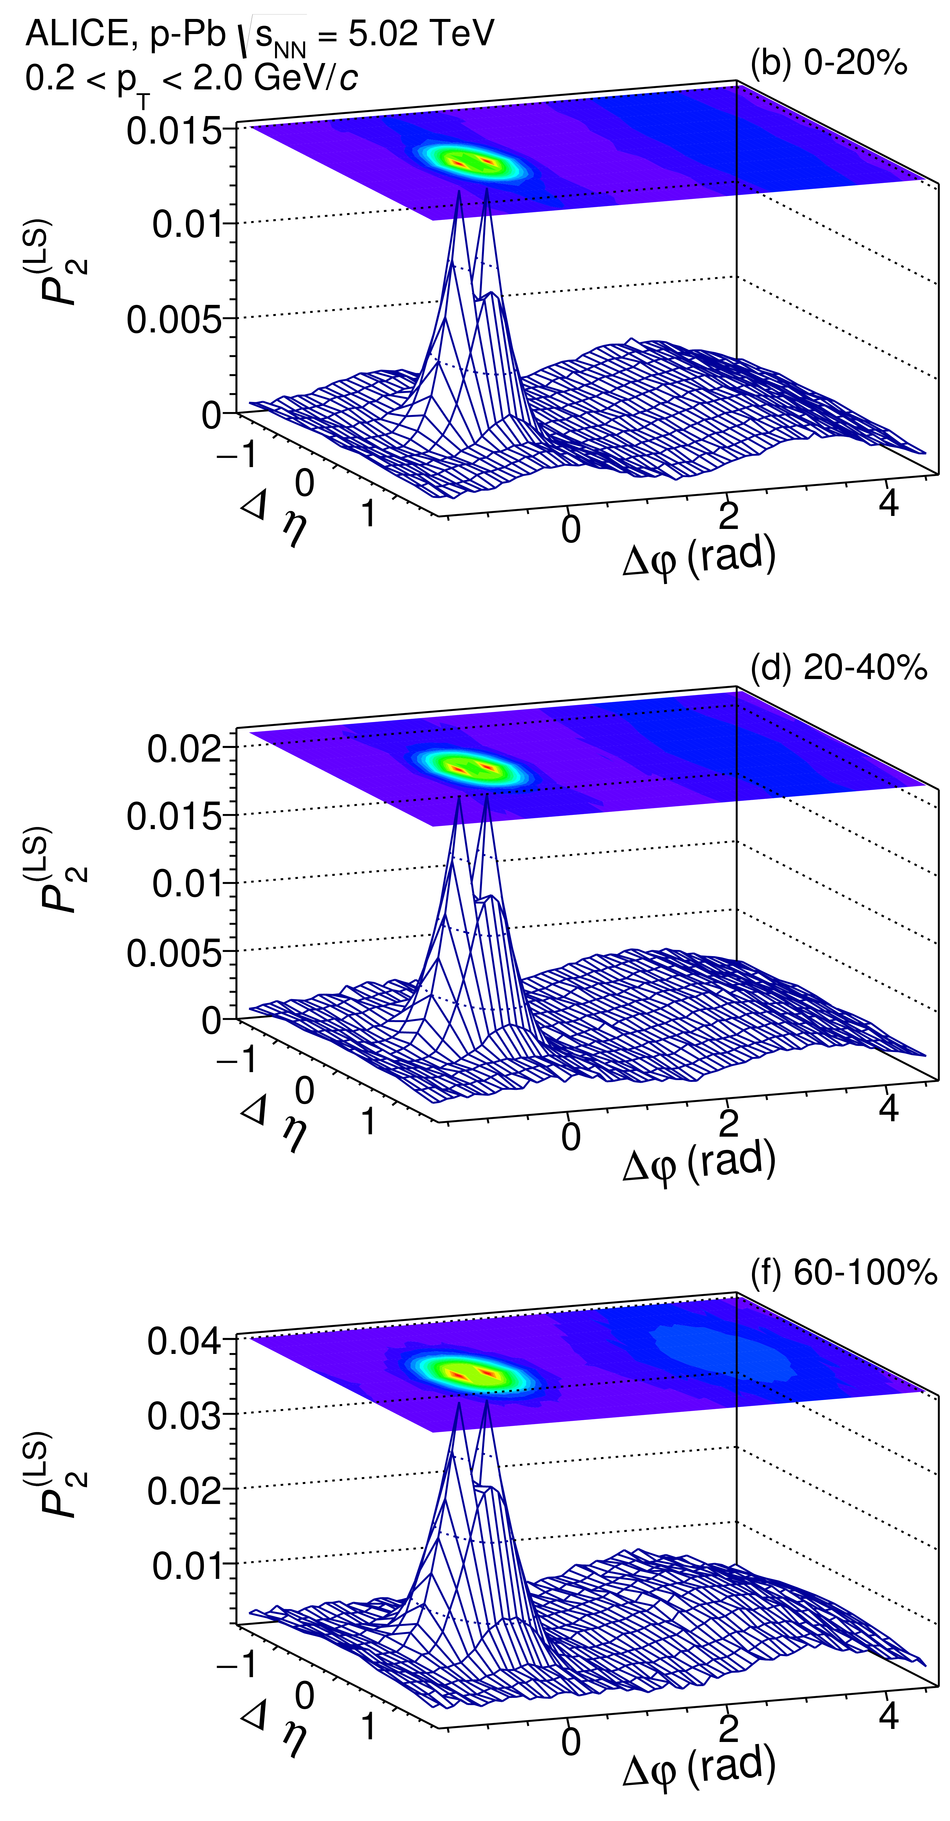
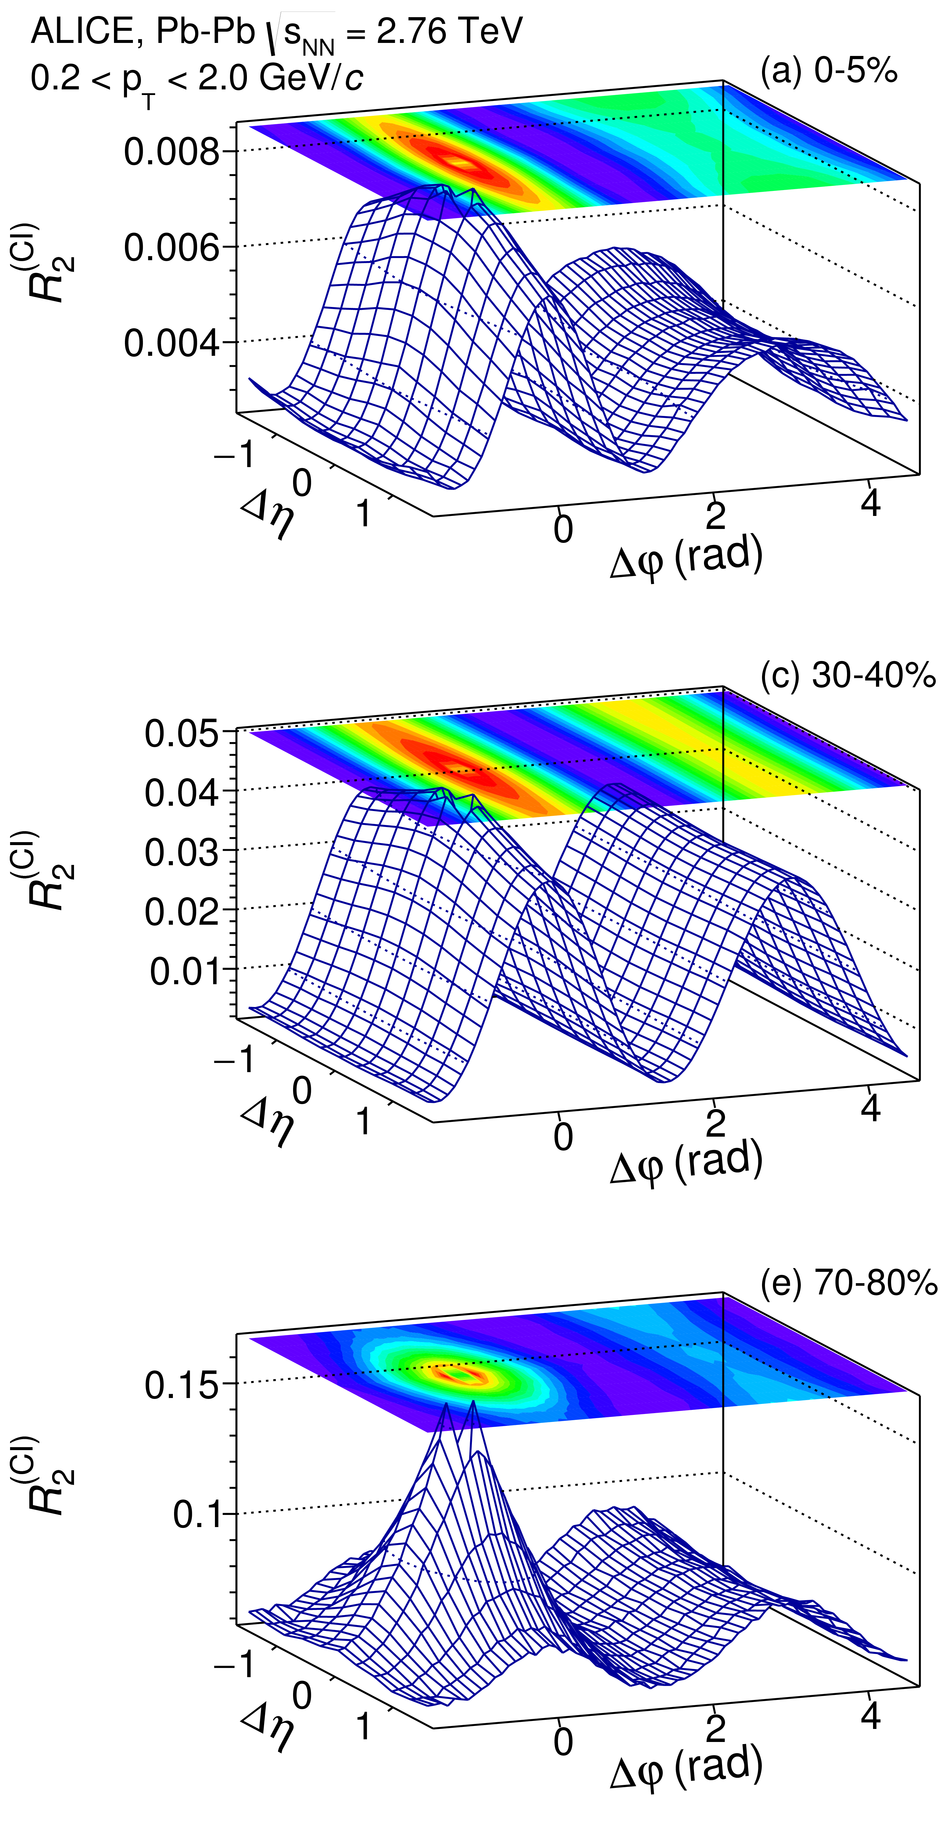
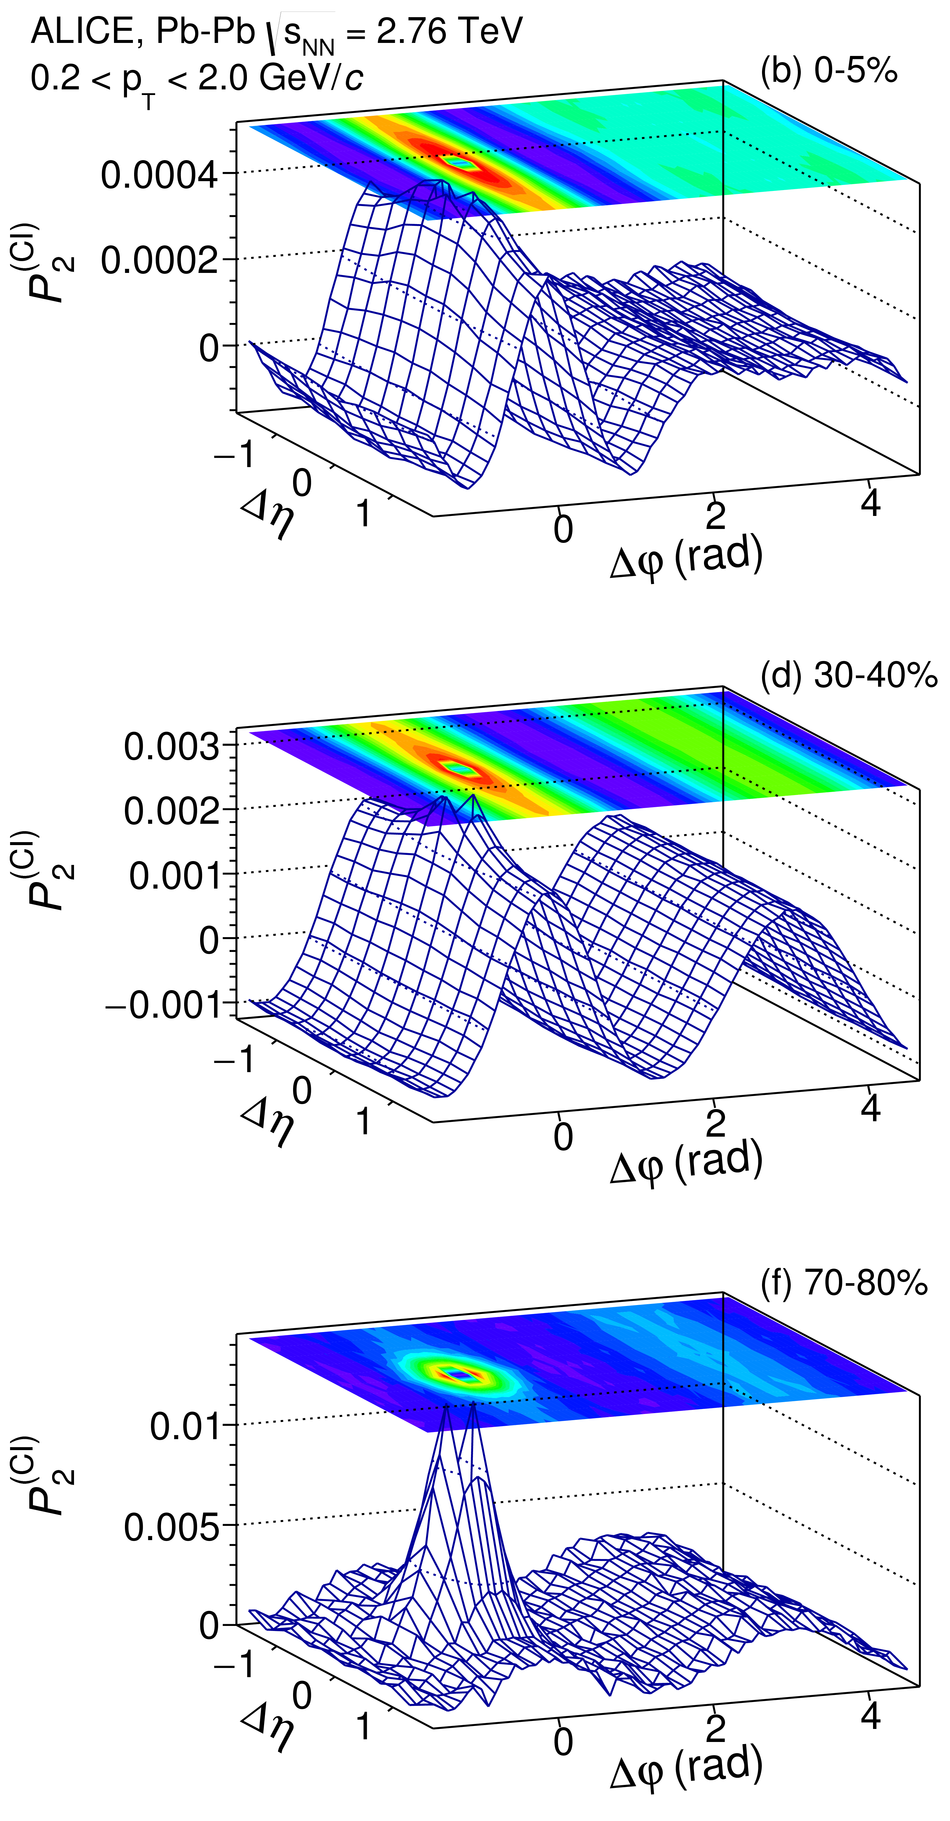
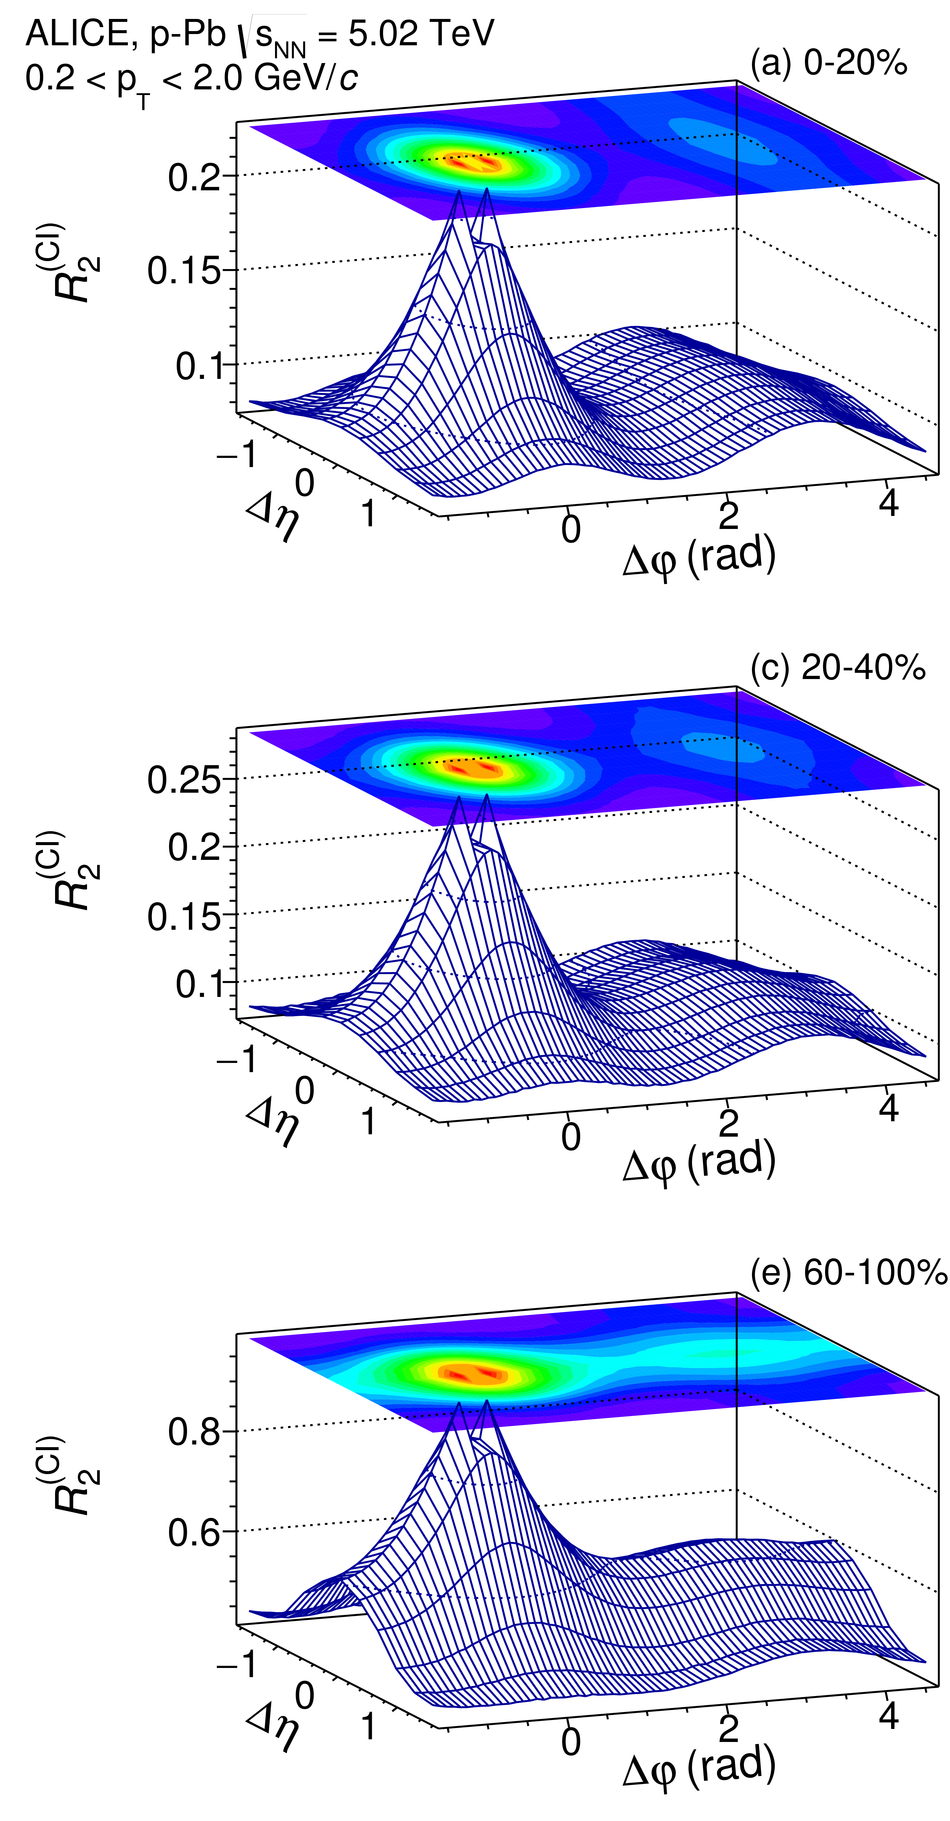


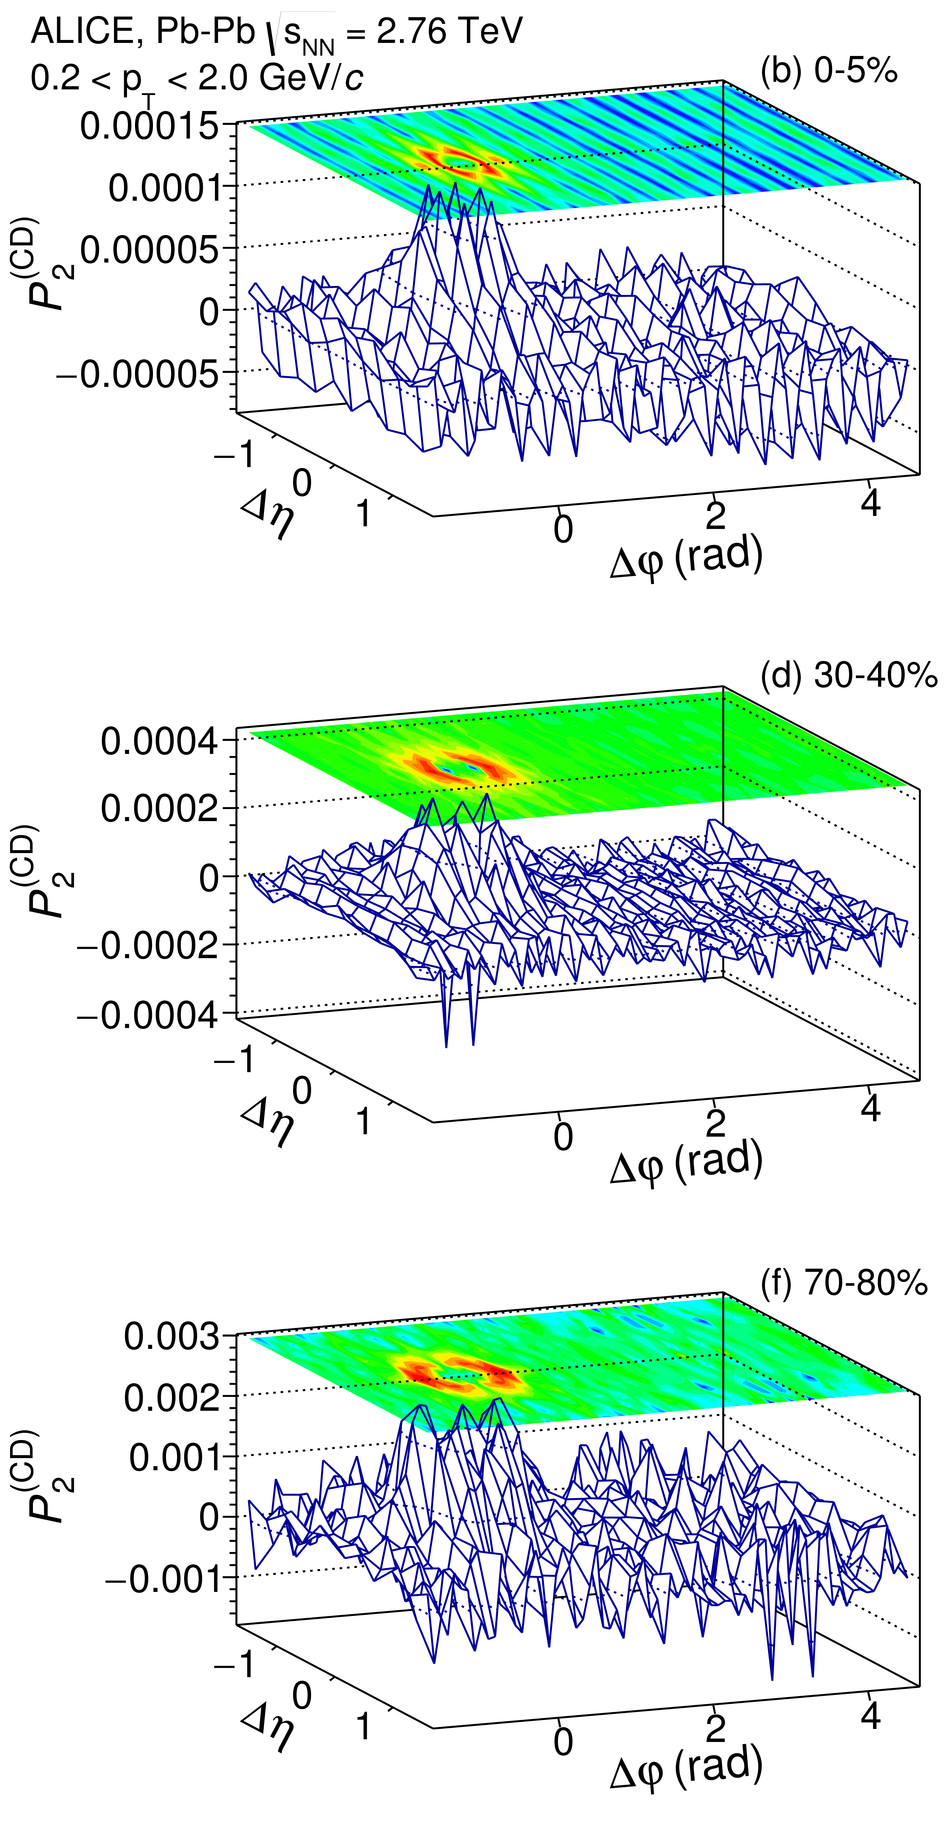
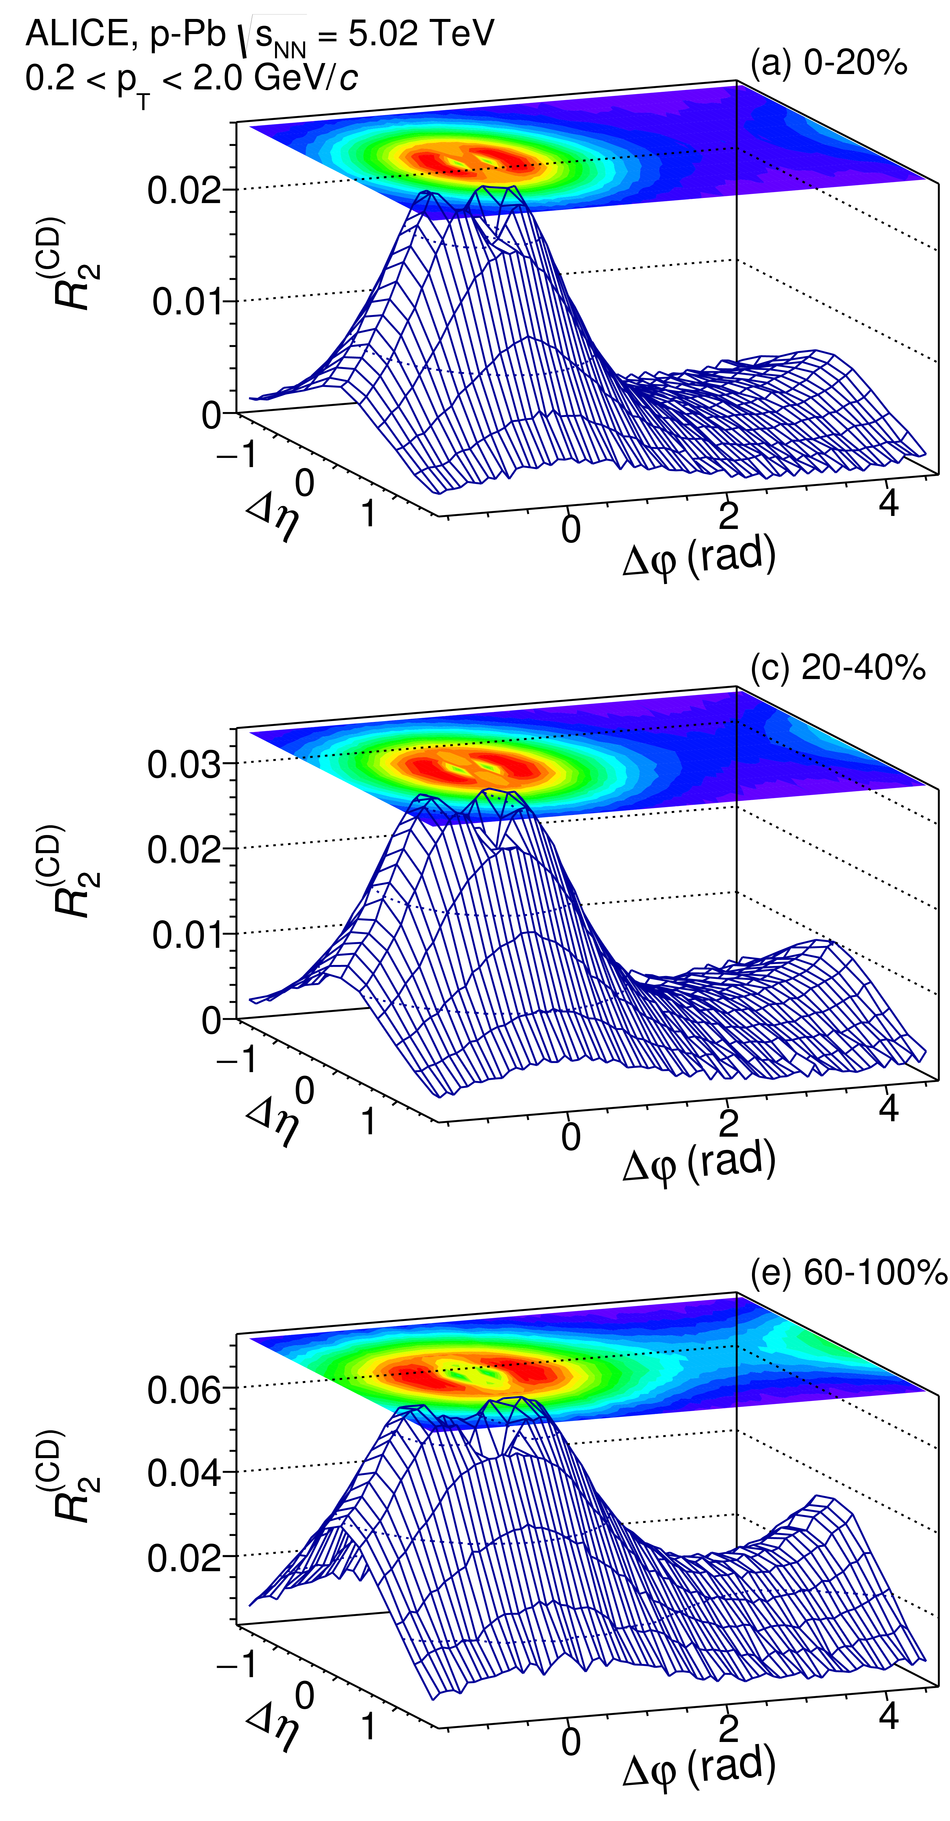
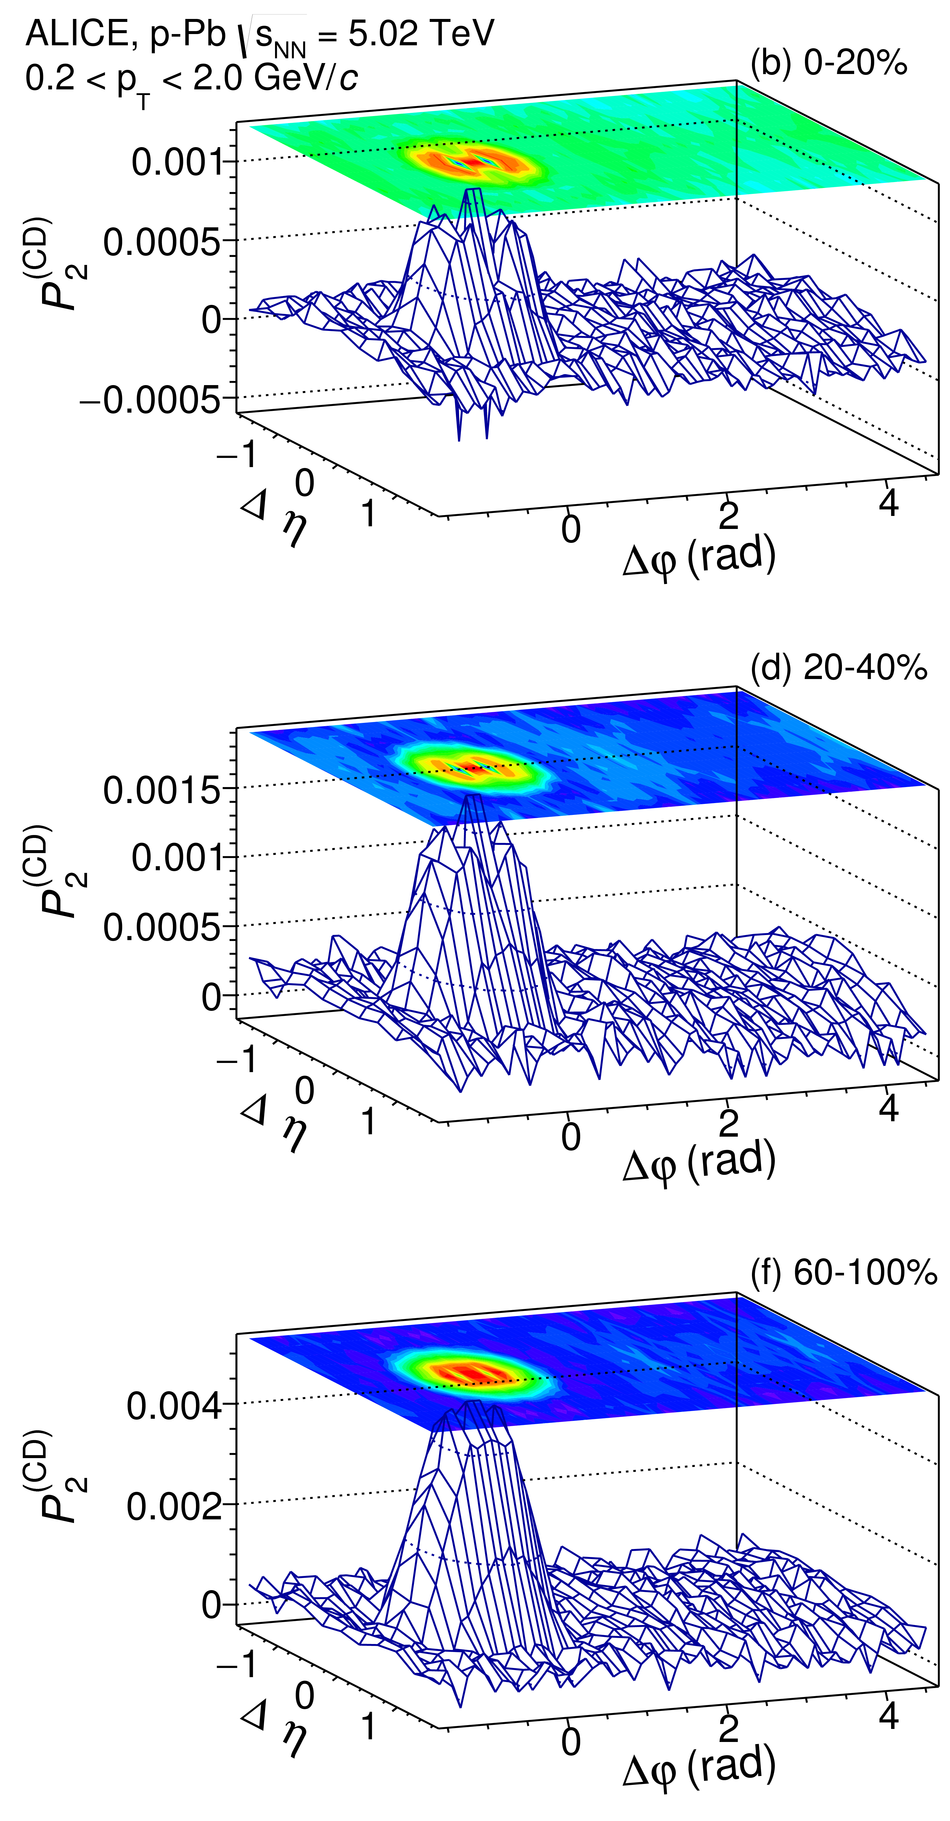
Figure 10
Projections of $R_2^{\rm (CI)}$ and $P_2^{\rm (CI)}$ correlation functions, measured in \PbPb\ collision at $\sqrt{s_{NN}} = 2.76$ TeV, for selected ranges of collisioncentrality. Projections onto the $\Delta\eta$ axis are calculated as averages of the two-dimensional correlations in the range $|\Delta \varphi| \le \pi$. Vertical bars and shaded areas represent statistical and systematic uncertainties, respectively. | 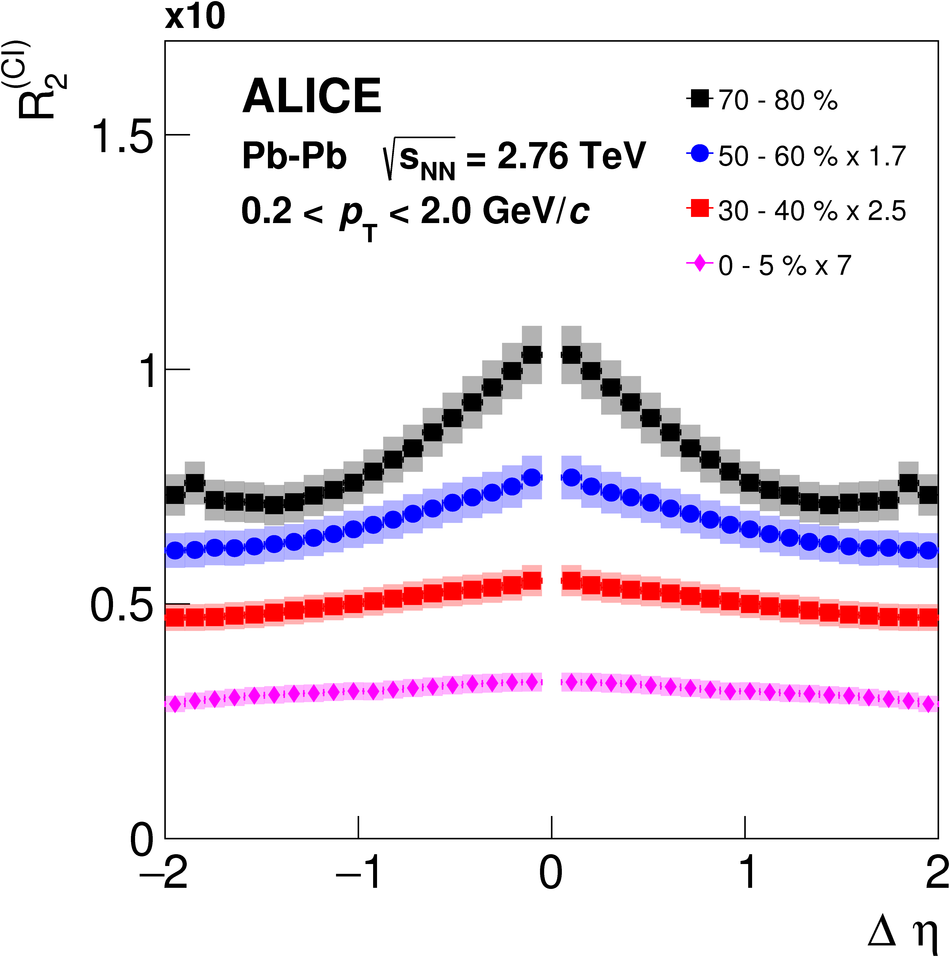 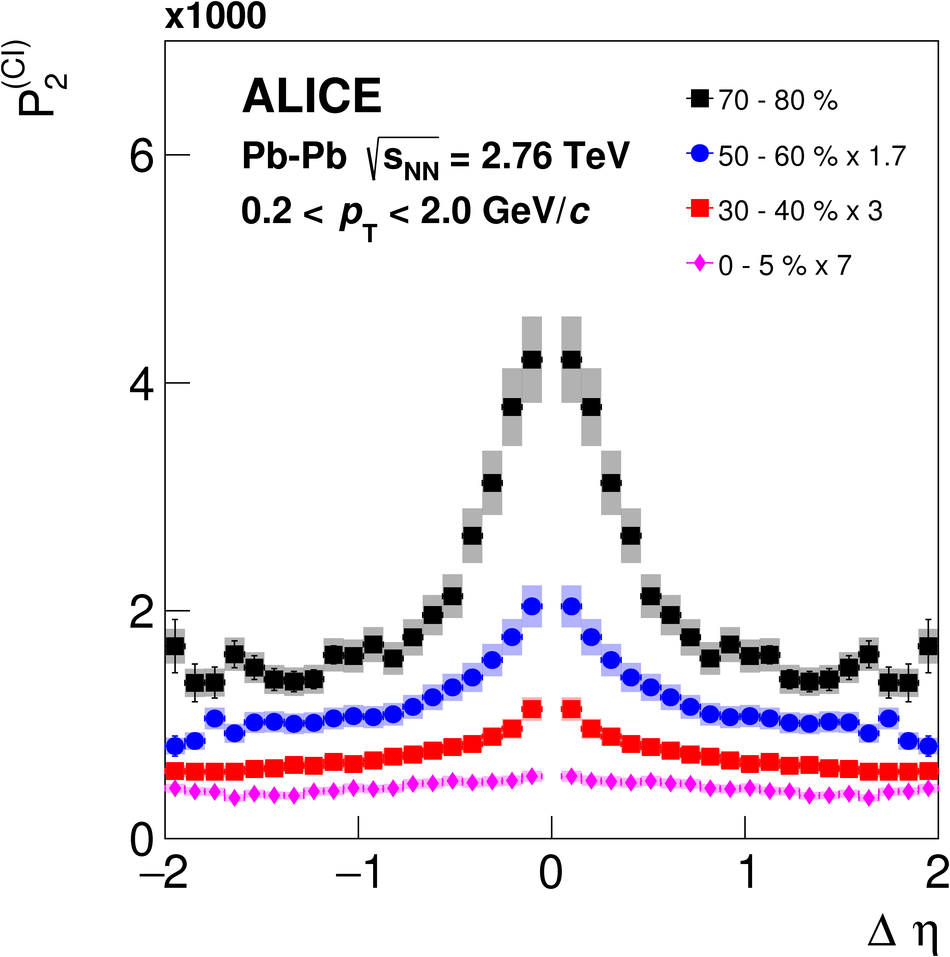 |
Figure 11
Projections of $R_2^{\rm (CI)}$ and $P_2^{\rm (CI)}$ correlation functions, measured in \pPb\ collisions at $\sqrt{s_{NN}} = 5.02$ TeV, for selected multiplicity classes. Projections onto the $\Delta\eta$ axis are calculated as averages of the two-dimensional correlations in the range $|\Delta \varphi| \le \pi$. Vertical bars and shaded areas represent statistical and systematic uncertainties, respectively. | 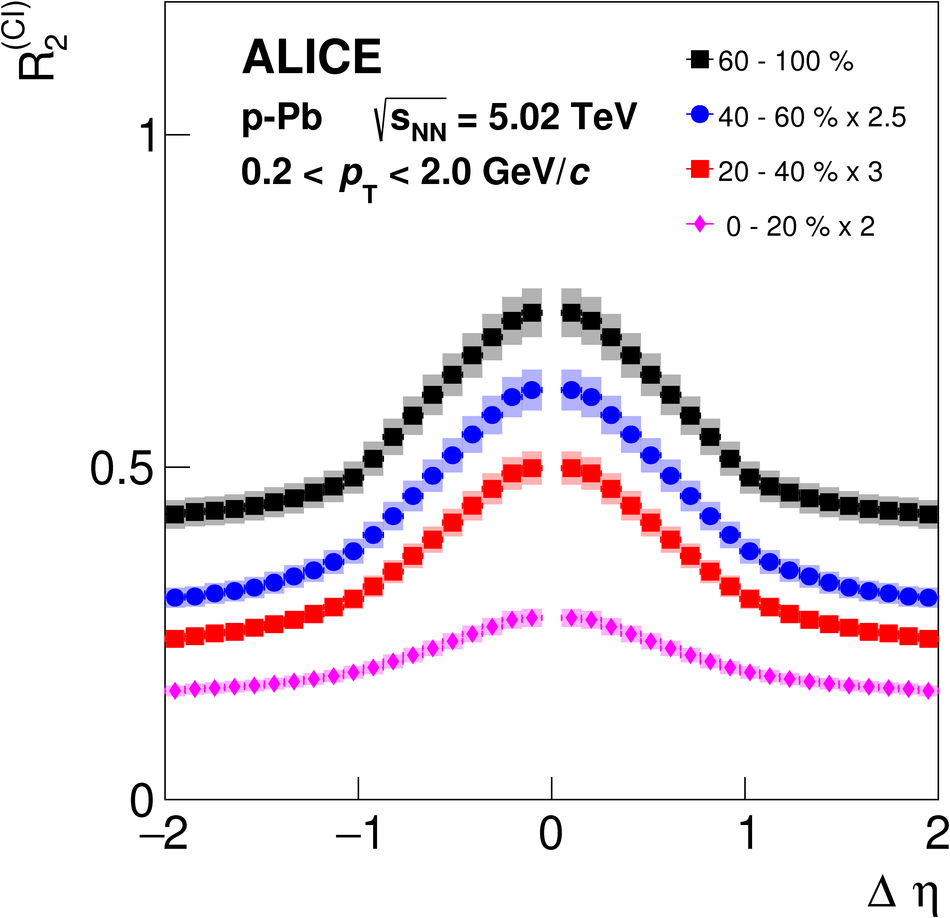 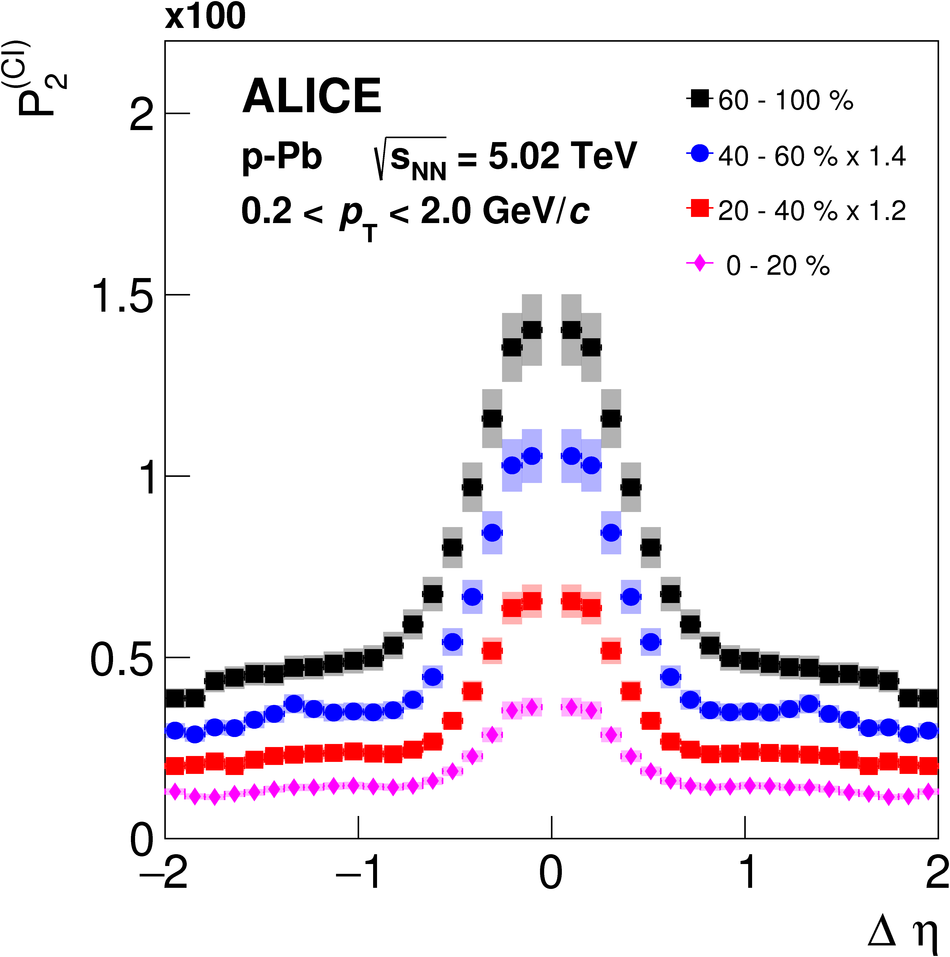 |
Figure 12
Projections of $R_2^{\rm (CD)}$ correlation functions, measured in \PbPb\ collision at $\sqrt{s_{NN}} = 2.76$ TeV, for selected ranges of collisioncentrality. The $\Delta\eta$ and $\Delta\varphi$ projections are calculated as averages of the two-dimensional correlations in the ranges $|\Delta \varphi| \le \pi$ and $|\Delta \eta| \le 1.8$, respectively. Vertical bars and shaded areas represent statistical and systematic uncertainties, respectively. | 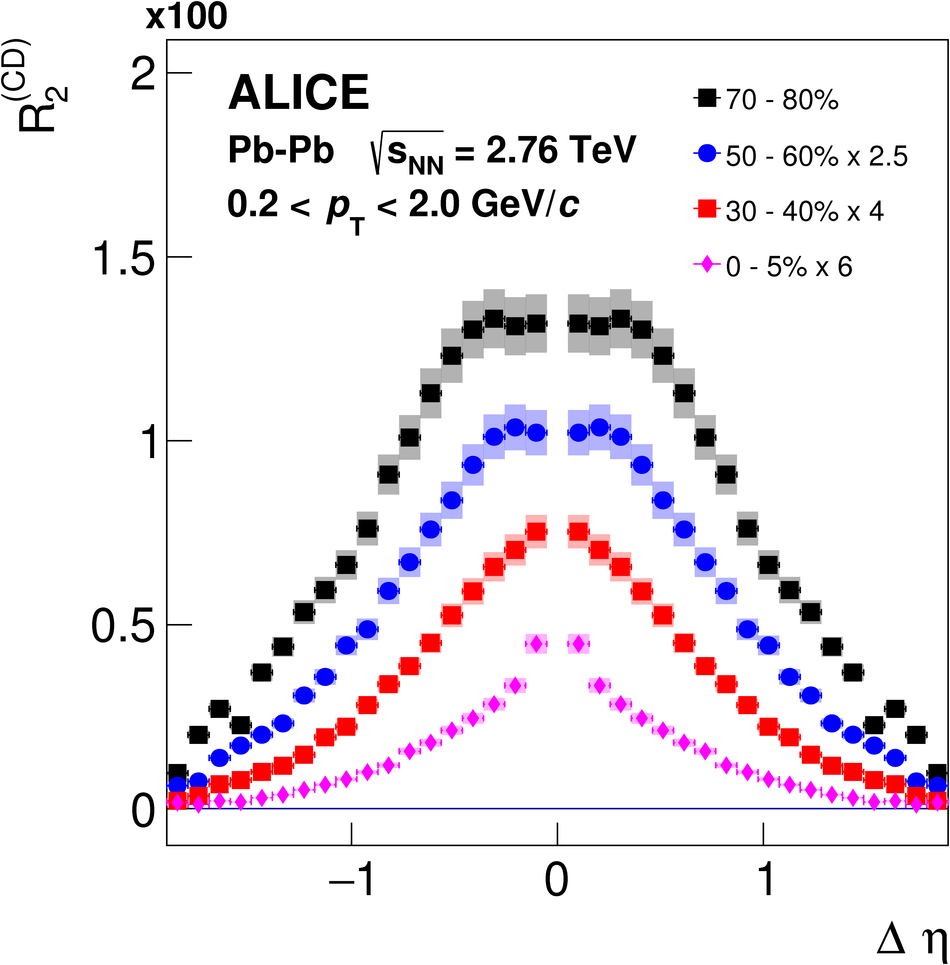 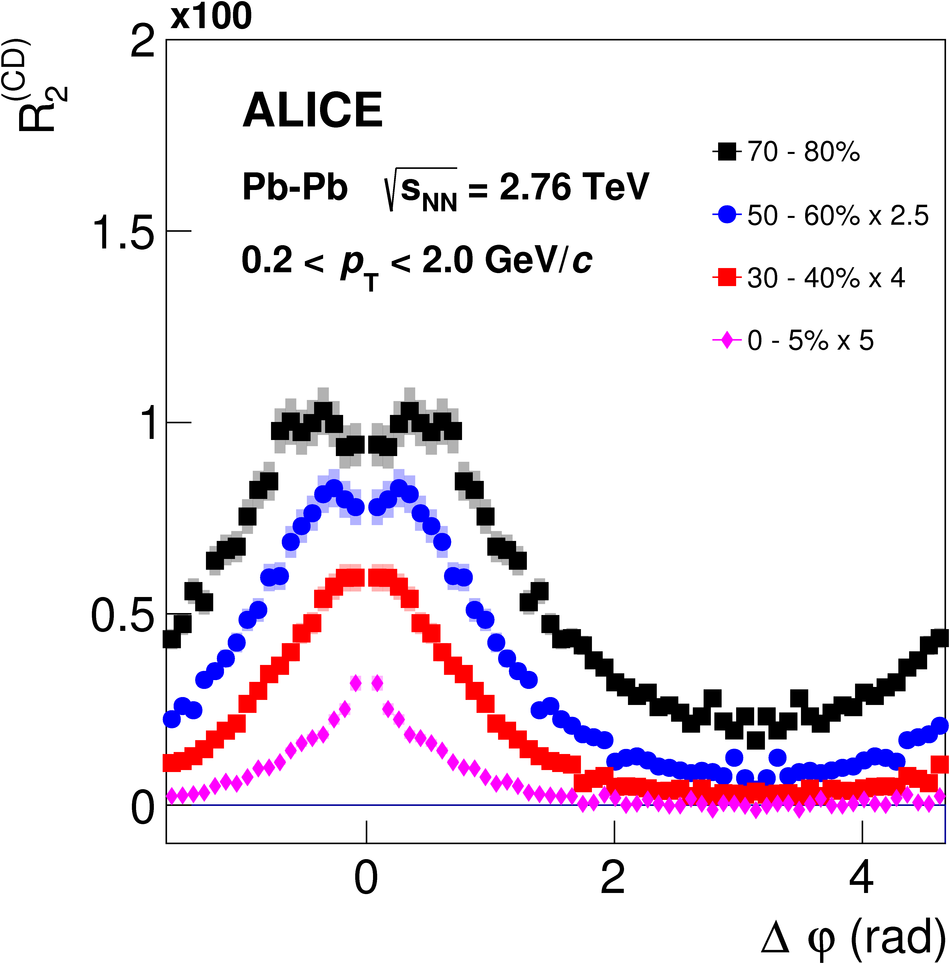 |
Figure 13
Projections of $P_2^{\rm (CD)}$ correlation functions, measured in \PbPb\ collision at $\sqrt{s_{NN}} = 2.76$ TeV, for selected ranges of collisioncentrality. The $\Delta\eta$ and $\Delta\varphi$ projections are calculated as averages of the two-dimensional correlations in the ranges $|\Delta \varphi| \le \pi$ and $|\Delta \eta| \le 1.8$, respectively. Vertical bars and shaded areas represent statistical and systematic uncertainties, respectively. | 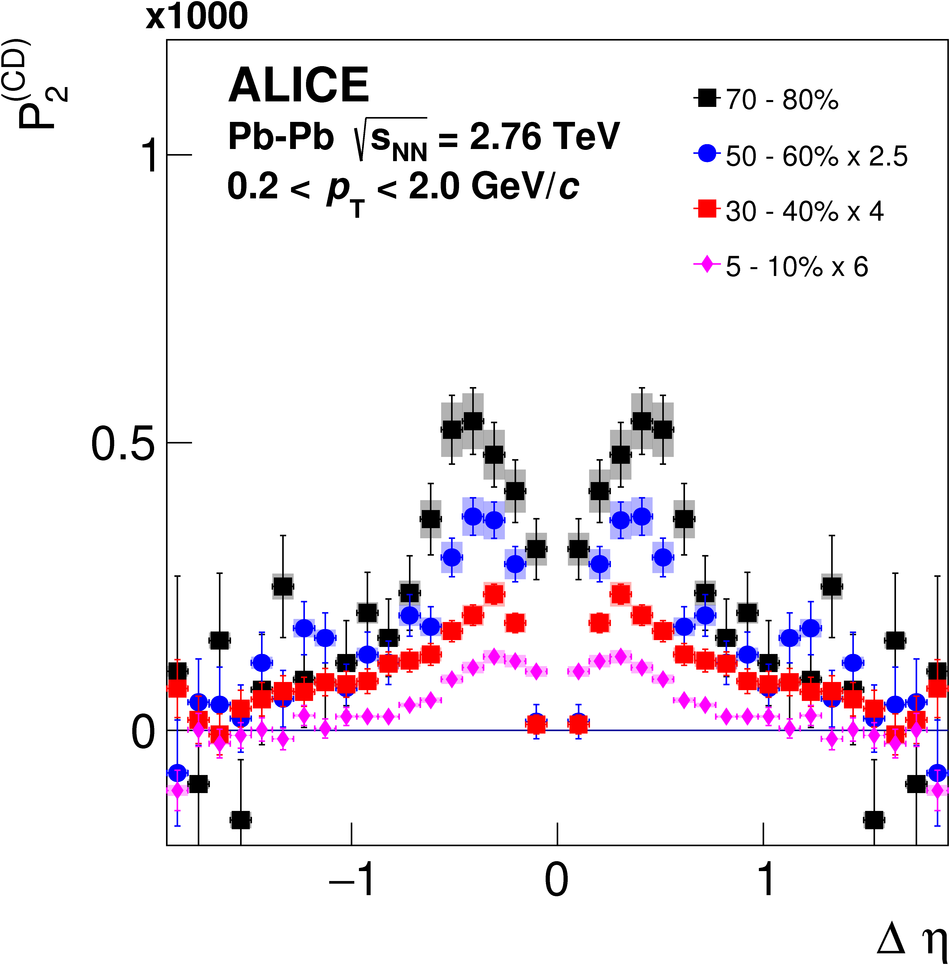 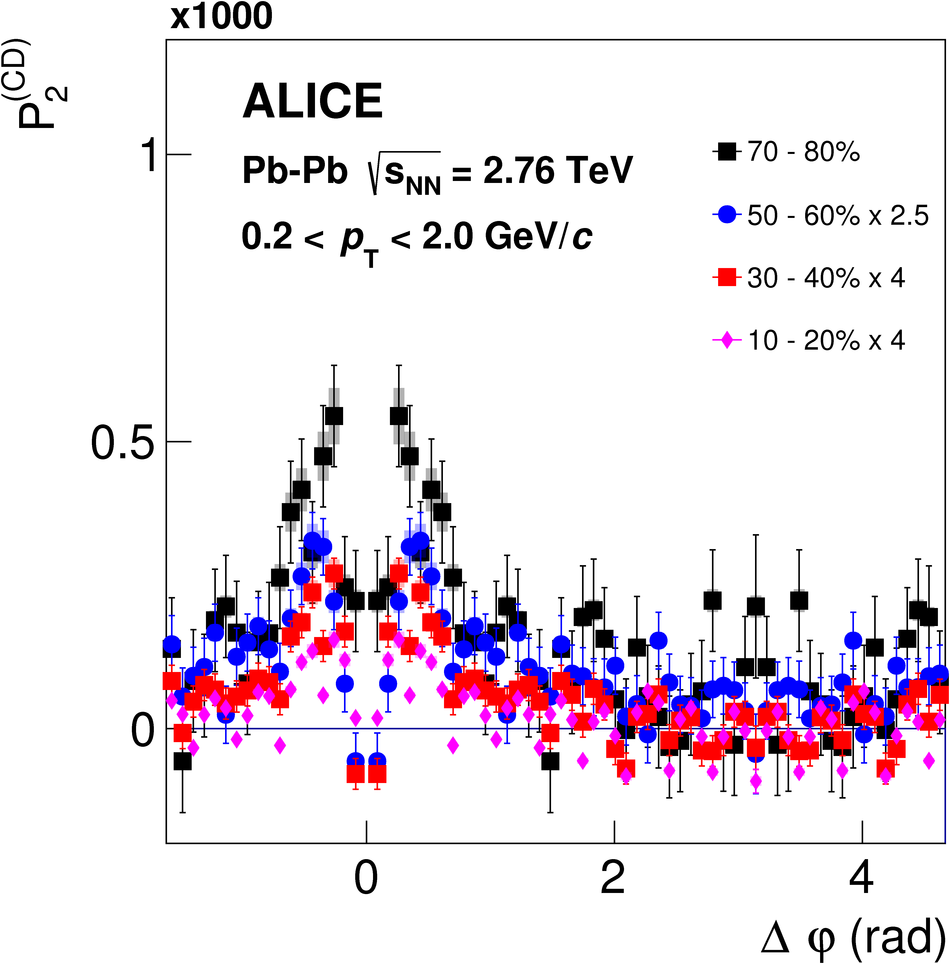 |
Figure 14
Projections of $R_2^{\rm (CD)}$ correlation functions, measured in \pPb\ collision at $\sqrt{s_{NN}} = 5.02$ TeV, for selected multiplicity classes. The $\Delta\eta$ and $\Delta\varphi$ projections are calculated as averages of the two-dimensional correlations in the ranges $|\Delta \varphi| \le \pi$ and $|\Delta \eta| \le 1.8$, respectively. Vertical bars and shaded areas represent statistical and systematic uncertainties, respectively. |  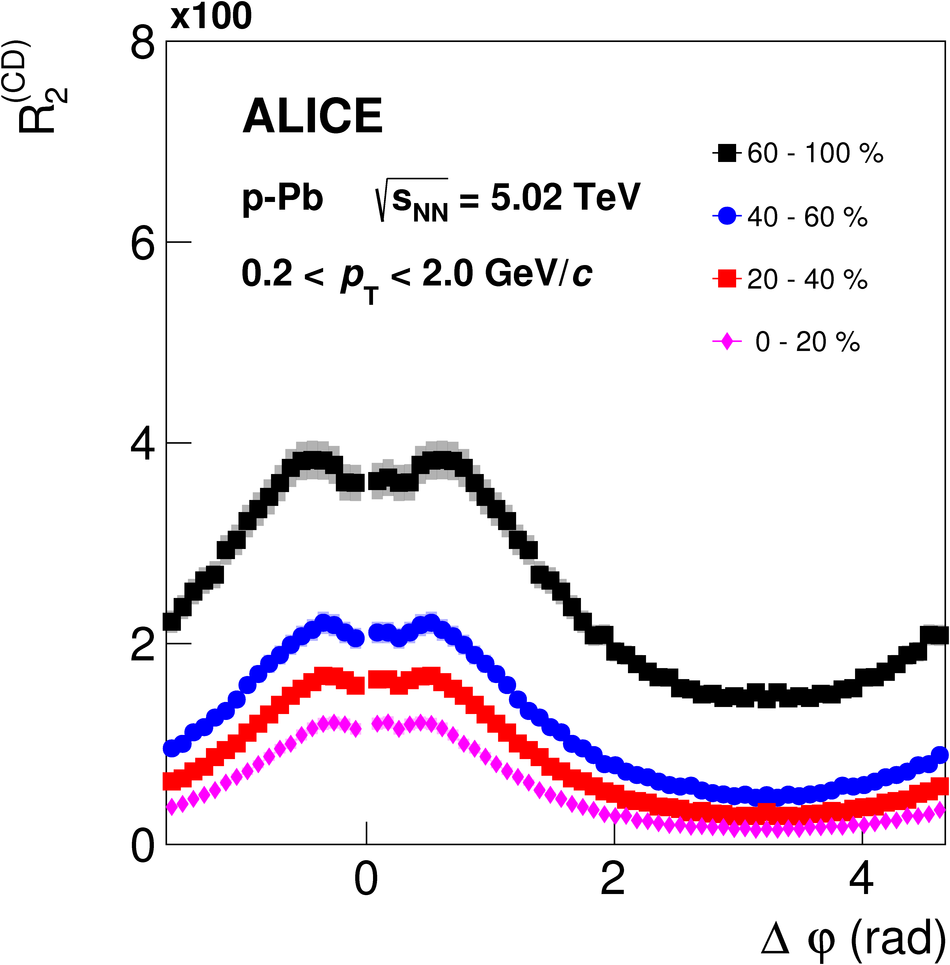 |
Figure 15
Projections of $P_2^{\rm (CD)}$ correlation functions, measured in \pPb\ collision at $\sqrt{s_{NN}} = 5.02$ TeV, for selected multiplicity classes. The $\Delta\eta$ and $\Delta\varphi$ projections are calculated as averages of the two-dimensional correlations in the ranges $|\Delta \varphi| \le \pi$ and $|\Delta \eta| \le 1.8$, respectively. Vertical bars and shaded areas represent statistical and systematic uncertainties, respectively. | 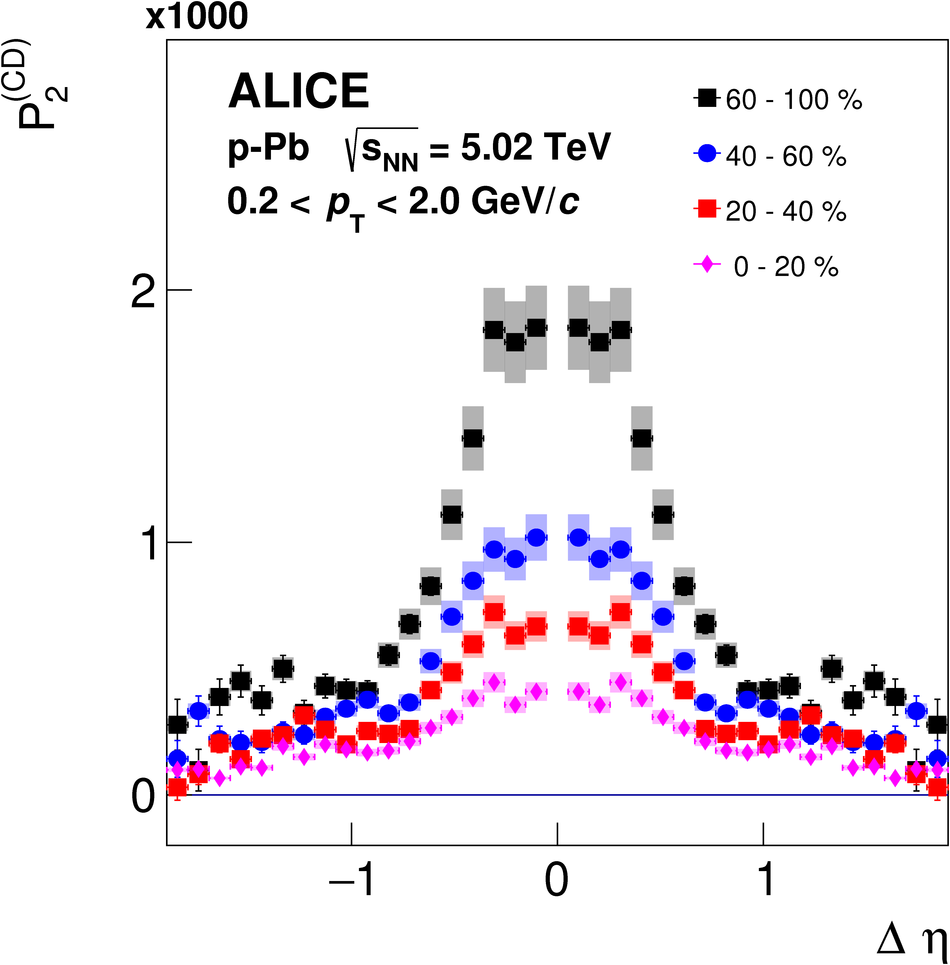 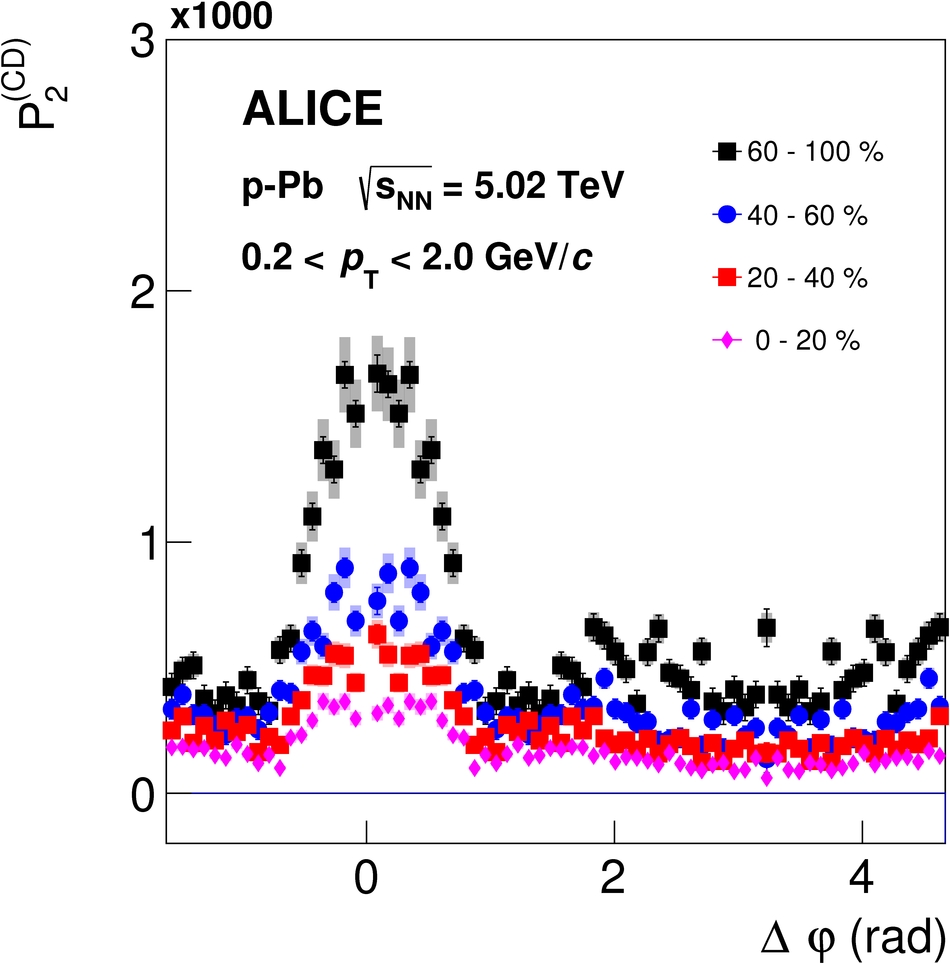 |
Figure 16
Width of the near-side peak of $R_2^{\rm (CI)}$ (left) and $P_2^{\rm (CI)}$ (right) correlation functions along $ \Delta \eta$ measured in\PbPb\ collisions as a function of the collision centrality class. Vertical bars and solid lines represent statistical and systematic uncertainties, respectively. | 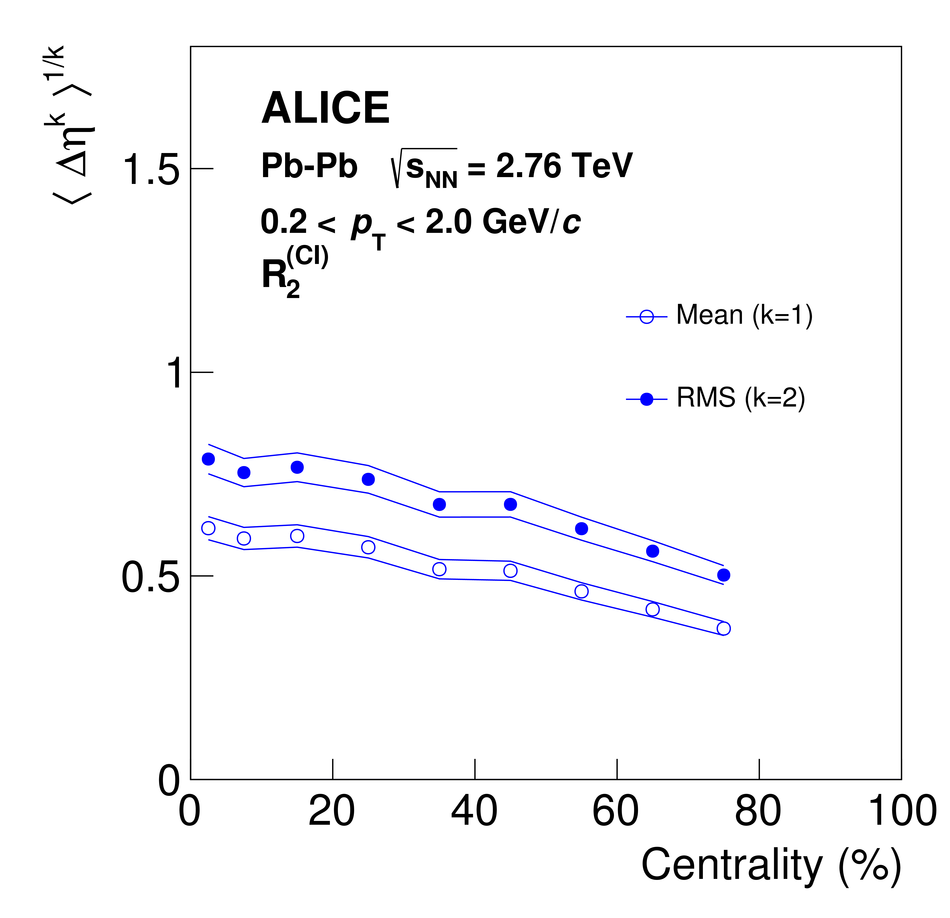 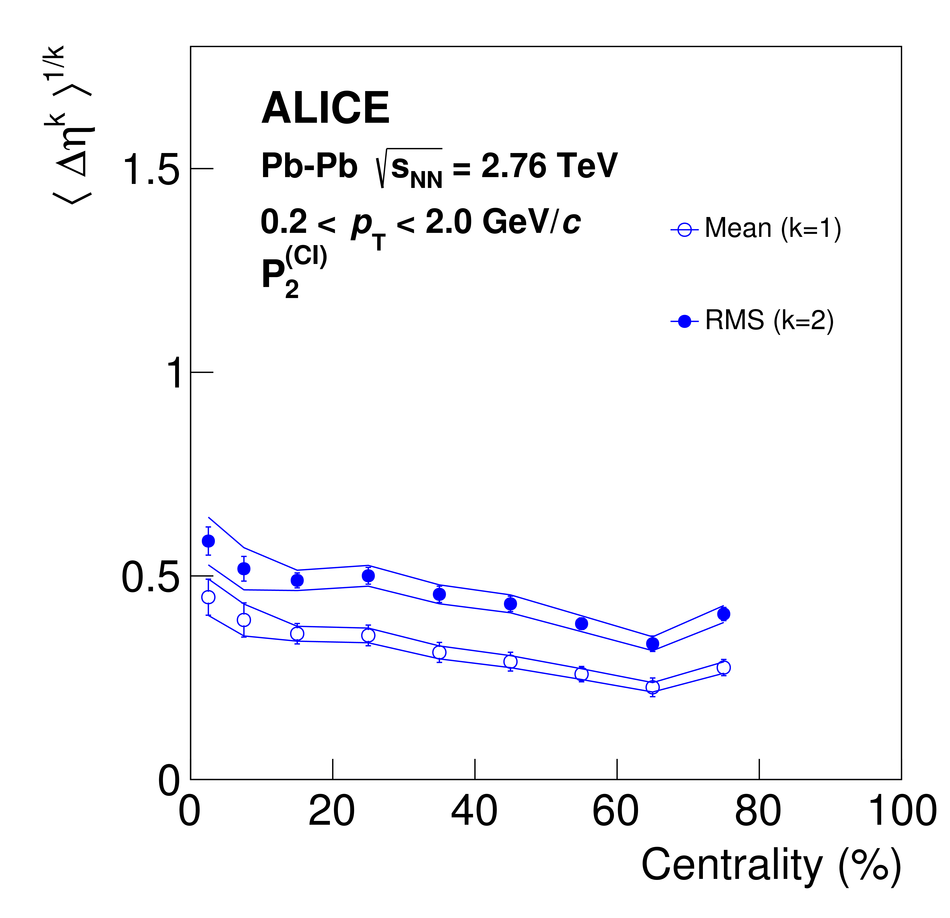 |
Figure 17
Width of the near-side peak of $R_2^{\rm (CI)}$ (left) and $P_2^{\rm (CI)}$ (right) correlation functions along $ \Delta \eta $ measured in \pPb\ collisions as a function of produced particle multiplicity class. Vertical bars and solid lines represent statistical and systematic uncertainties, respectively. | 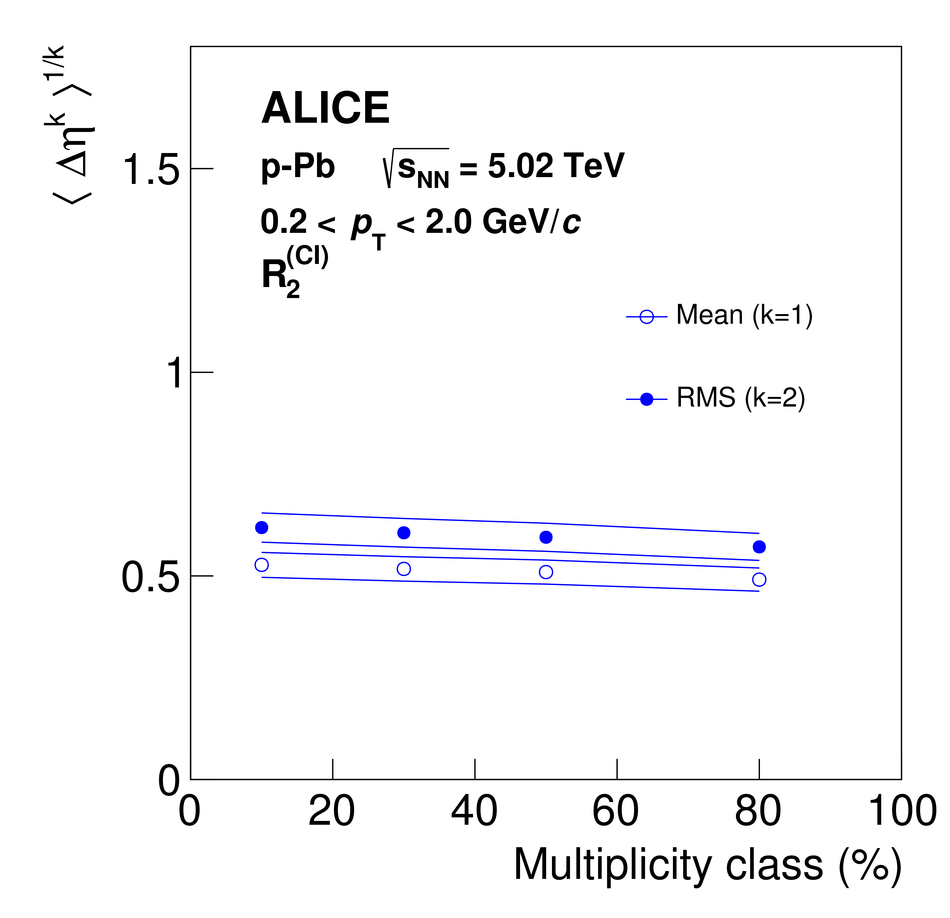 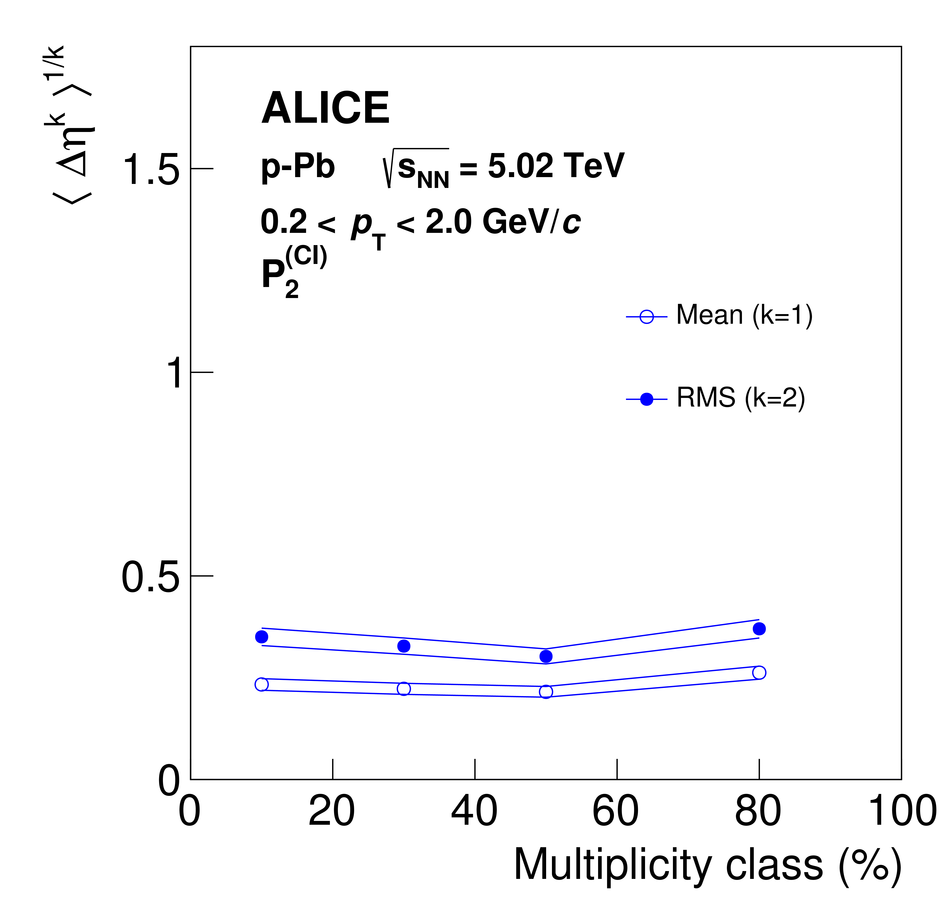 |
Figure 18
Width of the near-side peak of $R_2^{\rm (CD)}$ correlation functions along $ \Delta \eta $ (left) and $\Delta \varphi$ (right) measured in \PbPb\ collisions as a function of collision centrality class. Vertical bars and solid lines represent statistical and systematic uncertainties, respectively. Mean and RMS $\Delta \varphi$ widths (right: blue circles) were computed in the range $-\pi \le \Delta\varphi \le \pi$ with an offset according to Eq. (\ref{Eq:widthR2Phi}). Red symbols show RMS $\Delta\eta$ and $\Delta\varphi$ widths (systematic uncertainties shown as red dashed lines) reported by a prior ALICE analysis based on measurements of balance functions . The $\Delta\varphi$ widths reported in this earlier work were computed in the range $-\pi/2 \le \Delta\varphi \le \pi/2$. | 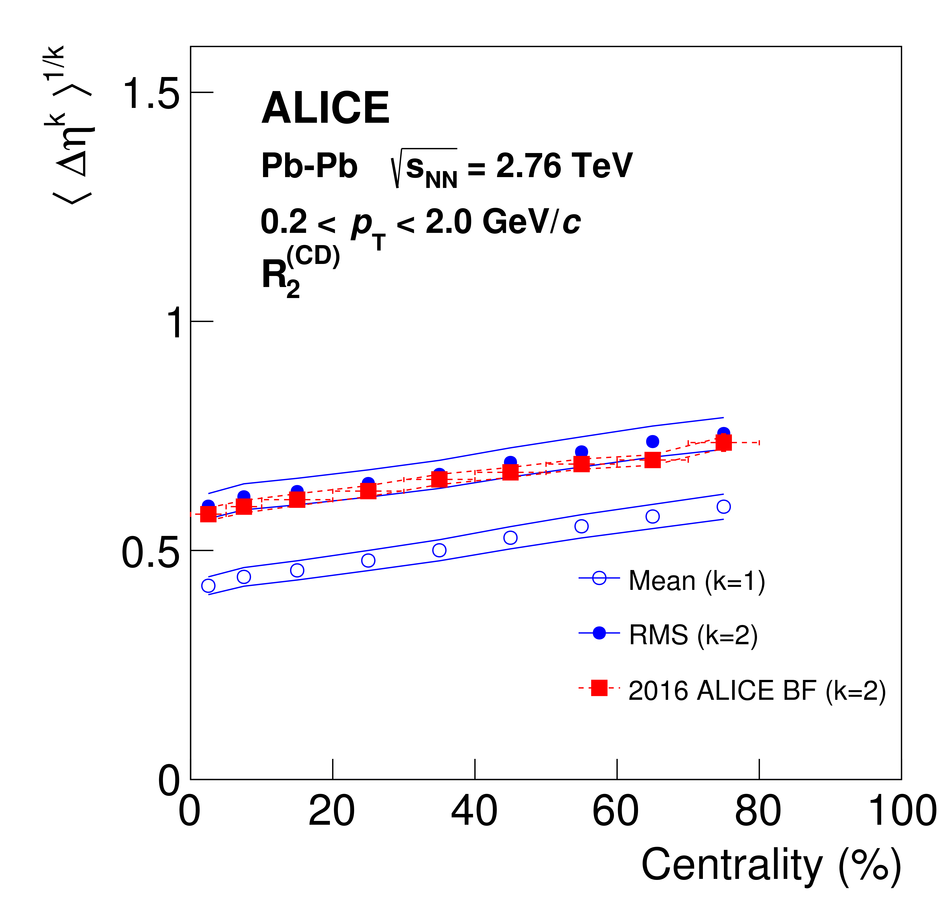 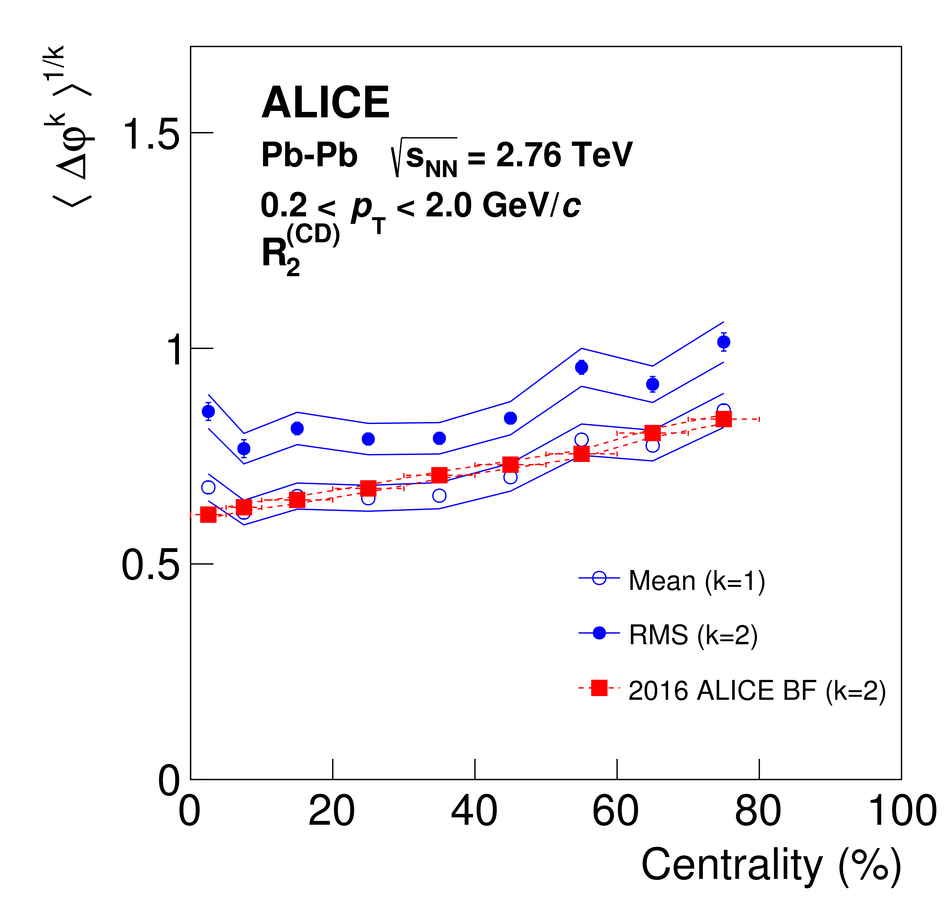 |
Figure 19
Width of the near-side peak of $P_2^{\rm (CD)}$ correlation functions along $\Delta \eta$ (left) and $\Delta \varphi$ (right) measured in \PbPb\ collisions as a function of collision centrality class. Vertical bars and solid lines represent statistical and systematic uncertainties, respectively. | 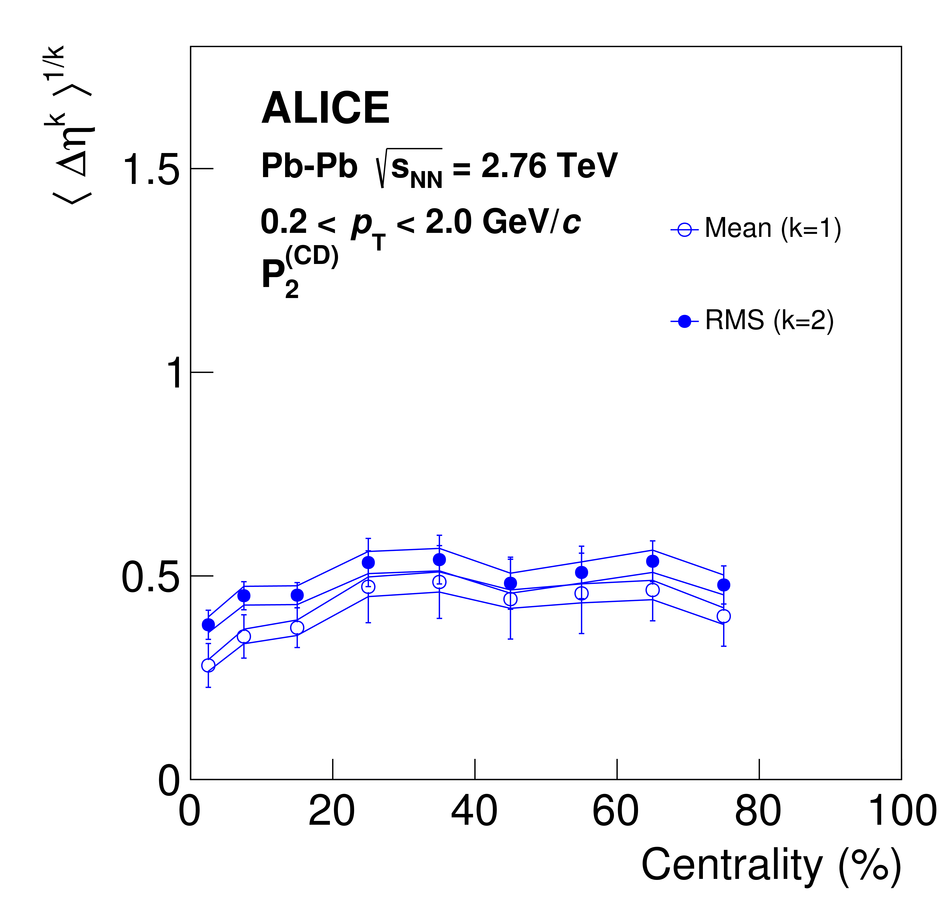 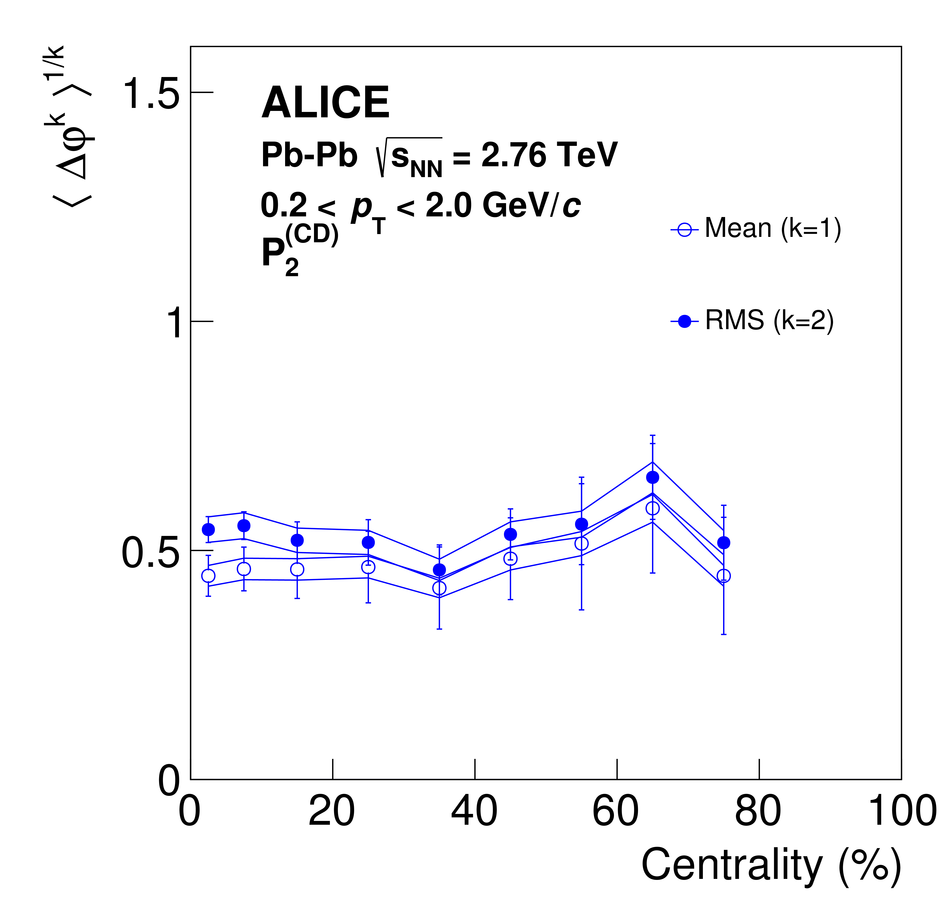 |
Figure 20
Width of the near-side peak of $R_2^{\rm (CD)}$ correlation functions along $\Delta \eta$ (left) and $\Delta \varphi$ (right) measured in \pPb\ collisions as a function of produced particle multiplicity class. Vertical bars and solid lines represent statistical and systematic uncertainties, respectively. Mean and RMS $\Delta \varphi$ widths (right: blue circles) were computed in the range $-\pi \le \Delta\varphi \le \pi$ with an offset according to Eq. (\ref{Eq:widthR2Phi}). Red symbols show RMS $\Delta\eta$ and $\Delta\varphi$ widths (systematic uncertainties shown as red dashed lines) reported by a prior ALICE analysis based on measurements of balance functions . The $\Delta\varphi$ widths reported in this earlier work were computed in the range $-\pi/2 \le \Delta\varphi \le \pi/2$. | 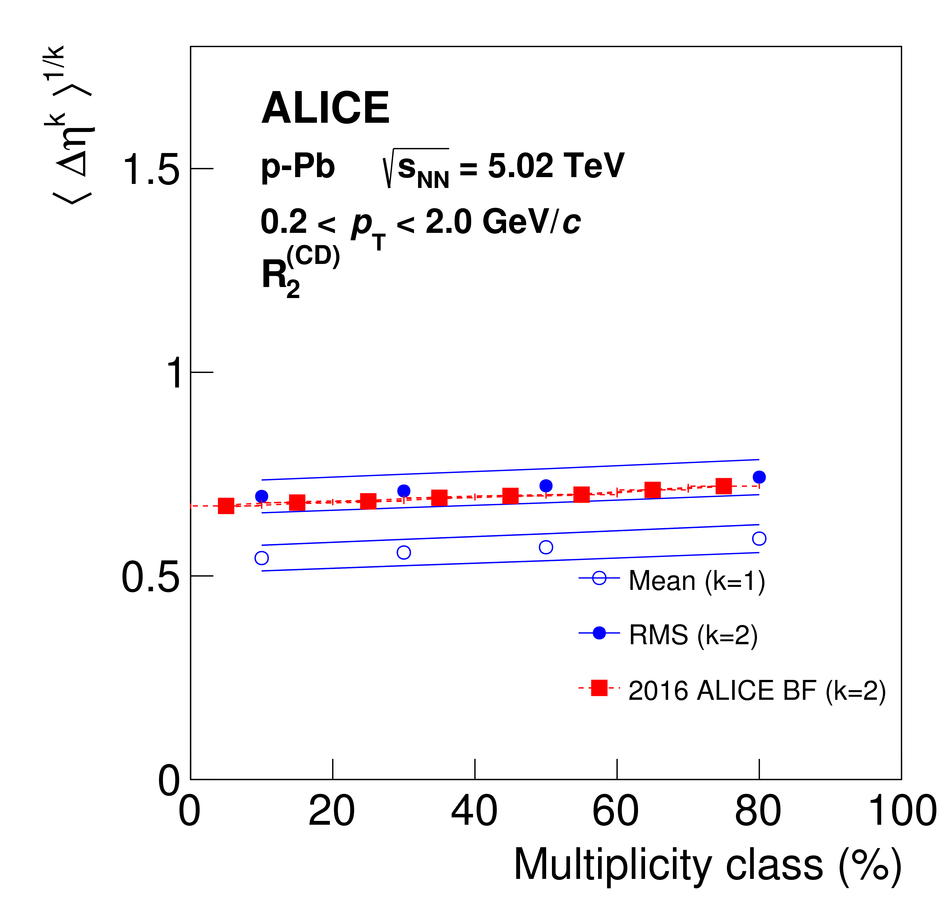  |
Figure 21
Width of the near-side peak of $P_2^{\rm (CD)}$ correlation functions along $\Delta \eta$ (left) and $\Delta \varphi$ (right) measured in \pPb\ collisions as a function of produced particle multiplicity class. Vertical bars and solid lines represent statistical and systematic uncertainties, respectively. | 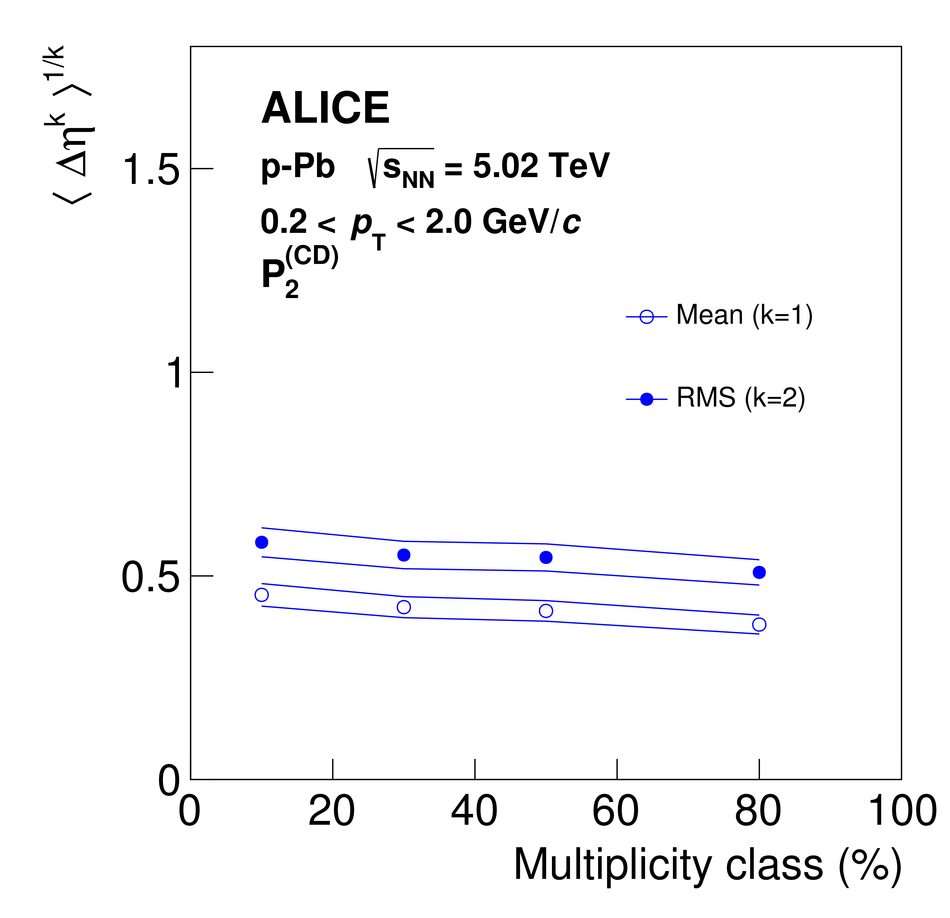  |
Figure 22
Width of the near-side peak of $R_2^{\rm (CD)}$ (left) and $P_2^{\rm (CD)}$ (right) correlation functions along $\Delta \varphi$ measured in\PbPb\ collisions as a function of the $\Delta \eta$ pair separation for selected collision centralities. Vertical bars and solid lines represent statistical and systematic uncertainties, respectively. | 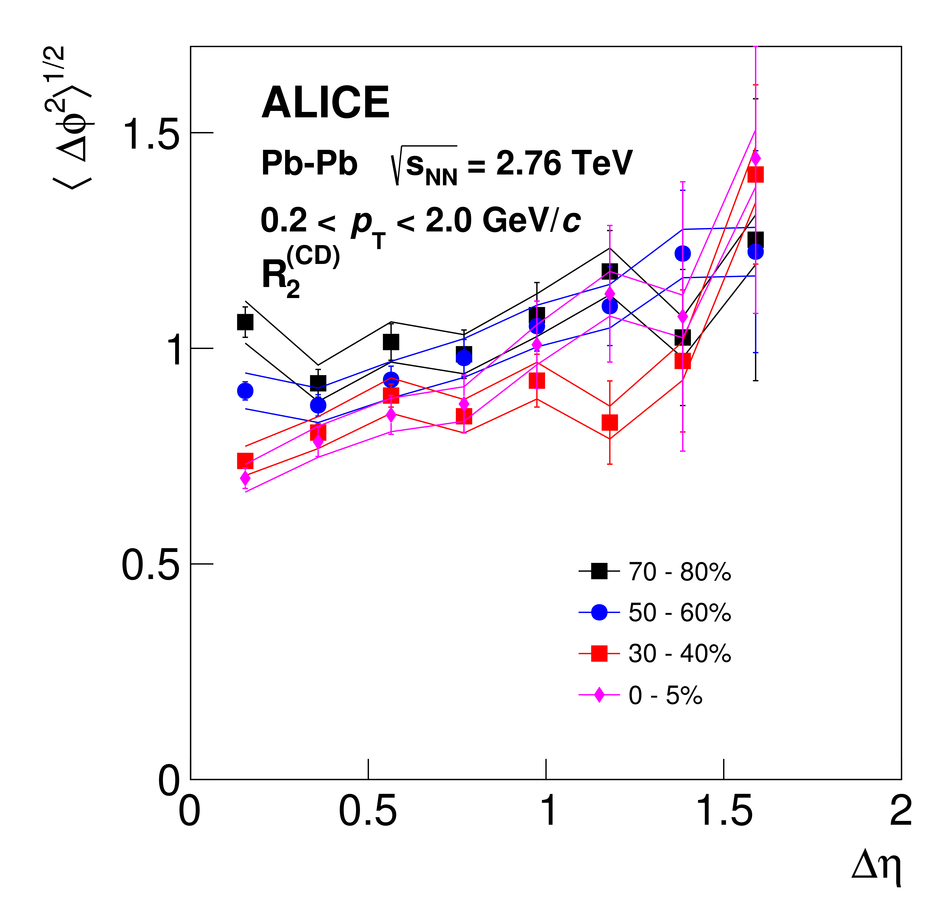 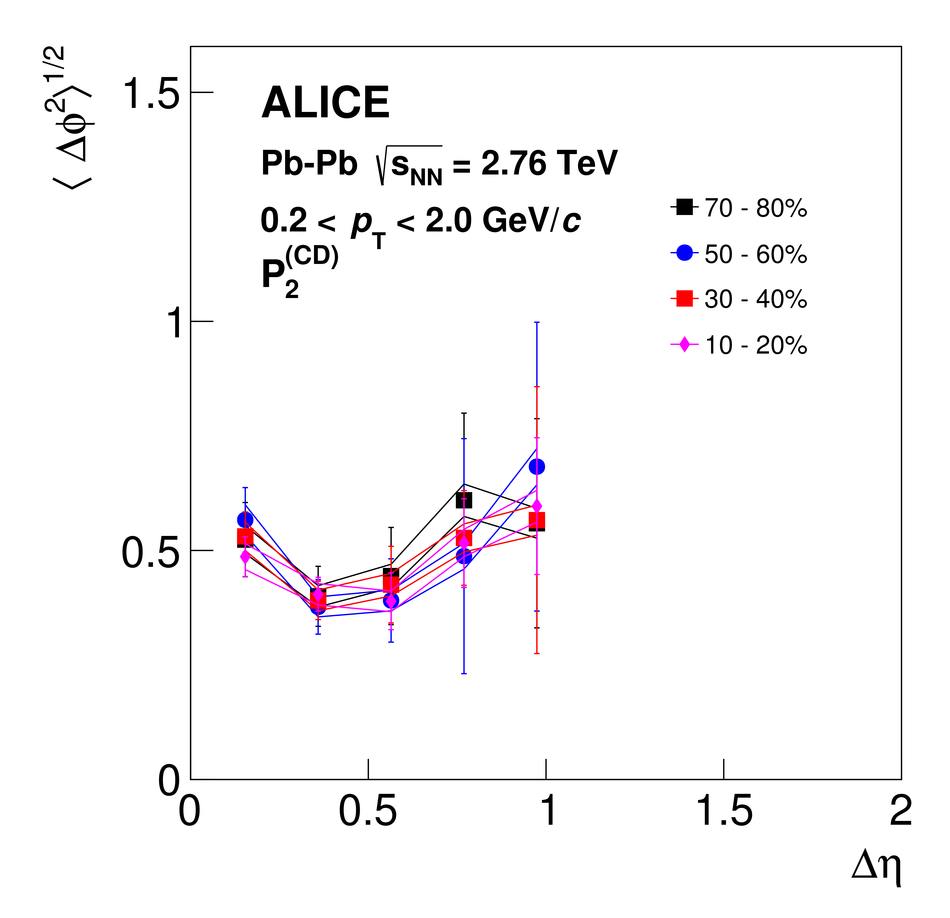 |
Figure 23
Width of the near-side peak of $R_2^{\rm (CD)}$ (left) and $P_2^{\rm (CD)}$ (right) correlation functions along $\Delta \varphi$ measured in \pPb\ collisions as a function of the $\Delta \eta$ pair separation for selected ranges of produced multiplicities. Vertical bars and solid lines represent statistical and systematic uncertainties, respectively. | 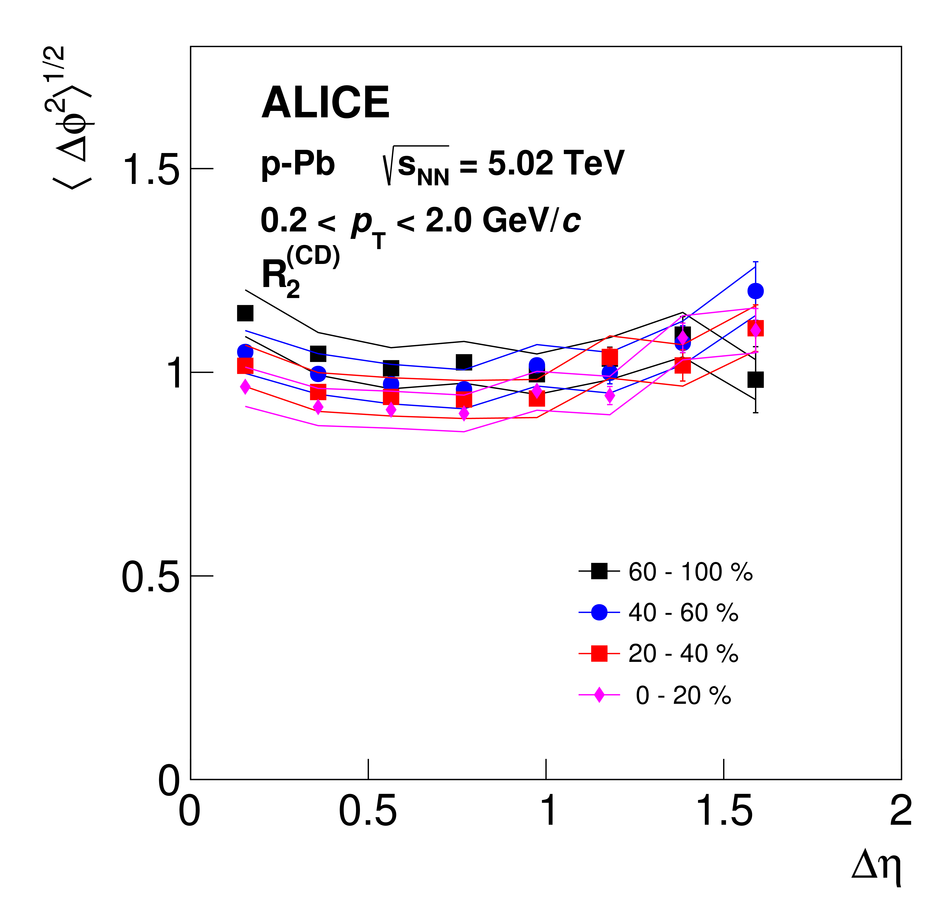 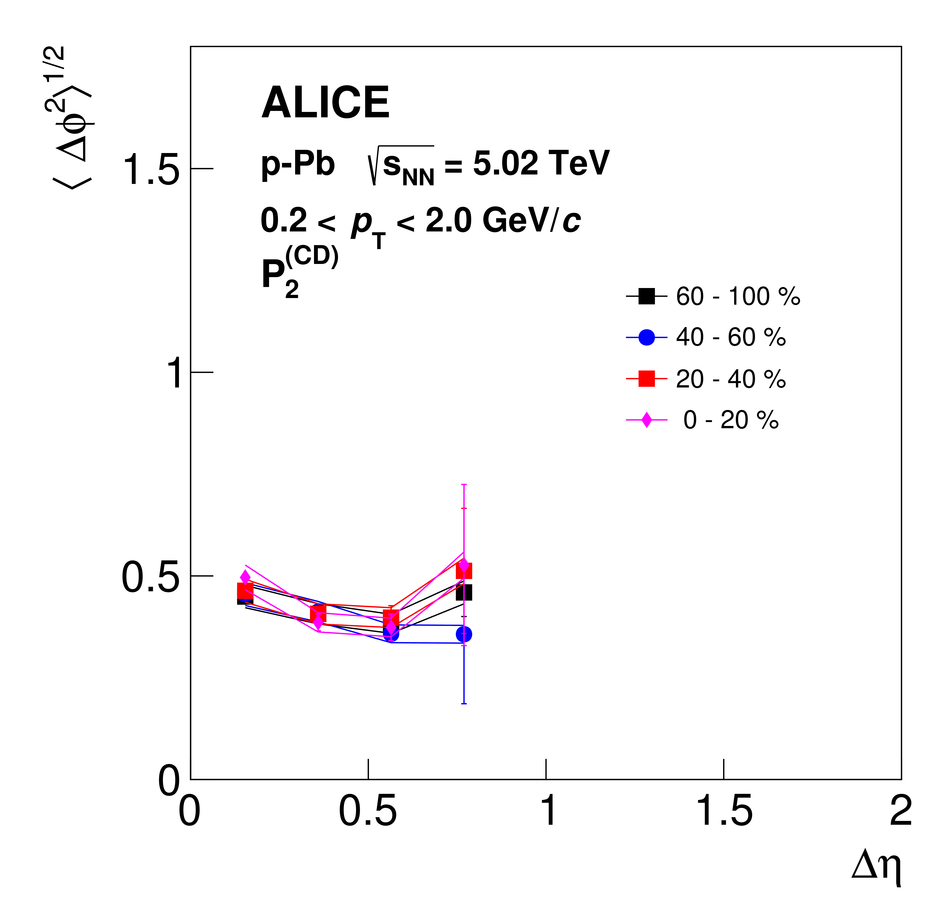 |
Figure 24
Fourier coefficients $v_{n}$, with $n=2,3,4$,extracted from US and LS $R_{2}$ correlation functions in the range$0.2 \leq |\Delta\eta| \leq 0.9$ and $0.9 \leq |\Delta\eta| \leq 1.9$ in panels(a) and (b), respectively. The ratios between US and LS $v_{n}$coefficients are shown in panels (c) and (d). Vertical bars and shaded areas represent statistical and systematic uncertainties, respectively. |  |
Figure 25
Solid symbols: coefficients $v_{n}$, $n=2,3,4$,obtained from Fourier decompositions of charge-independent correlators, $R_{2}^{\rm (CI)}$,in the ranges $0.2 \leq |\Delta\eta| \leq 0.9$ (left) and $0.9 \leq |\Delta\eta| \leq 1.9$ (right). Open symbols; flow coefficients $v_{n}$ obtained with the scalar-product method according to Eq. (\ref{Eq:mth_sp}). Panels (c) and (d): Ratios of the coefficients $v_{n}$ values obtained from $R_{2}^{\rm (CI)}$ to those obtained with the scalar-product method. Vertical bars and shaded areas indicate statistical and systematic uncertainties, respectively. | 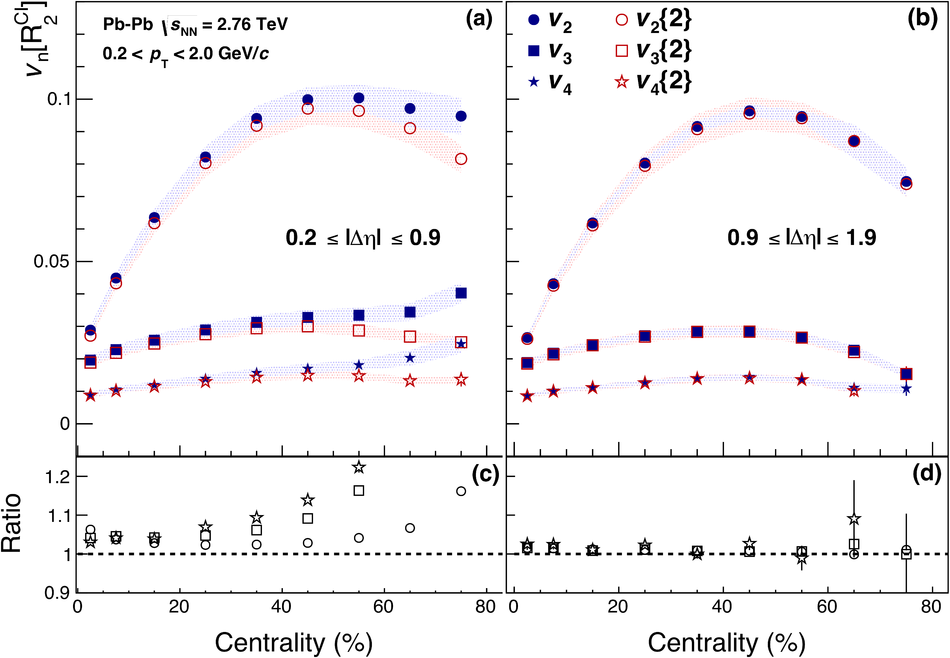 |
Figure 26
Fourier coefficients with $n=2,3,4$obtained in $P_{2}$ for US and LS charge-correlations in the ranges$0.2 \leq |\Delta\eta| \leq 0.9$ and $0.9 \leq |\Delta\eta| \leq 1.9$ in panels(a) and (b), respectively. The ratios between US and LS $v_{n}$coefficients are shown in panels (c) and (d). Vertical bars and shaded areas indicate statistical and systematic uncertainties, respectively. | 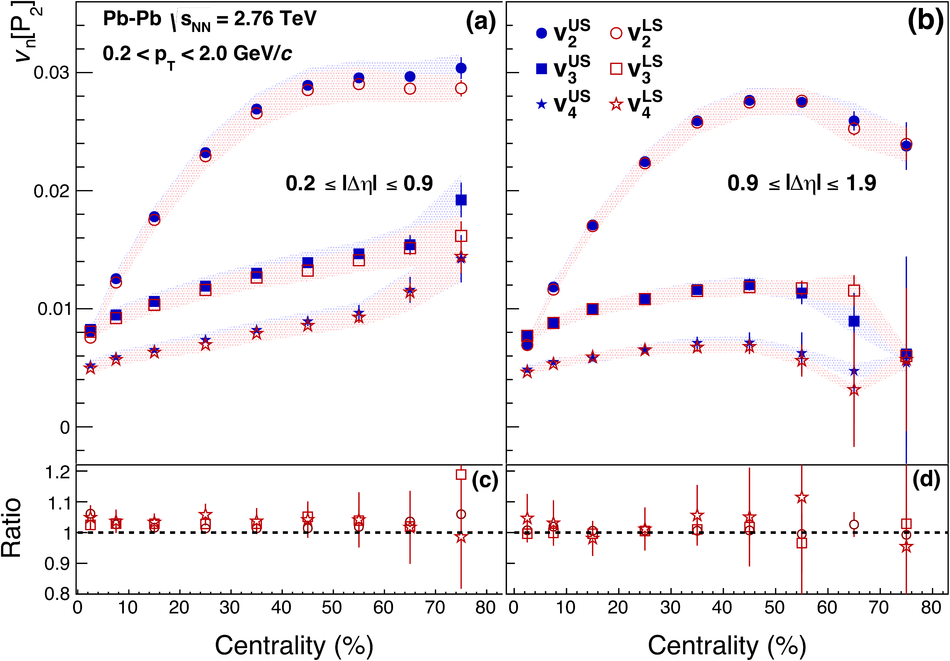 |
Figure 27
Pair separation, $|\Delta\eta|$, dependence of Fourier coefficients$v_{n}[R_2^{\rm (CI)}]$ (panel a) and $v_{n}[P_2^{\rm (CI)}]$ (panel b), with $n=2,3,4$,obtained from $R_2^{\rm (CI)}$ and $P_2^{\rm (CI)}$ correlation functions in \PbPb\ 5\% most central collisions. Panels (c,d) display ratios of the coefficients to $v_n(|\Delta\eta|)$ to their respective values at $|\Delta\eta|=0.3$. Vertical bars and shaded areas indicate statistical and systematic uncertainties, respectively. Reproduced from . | 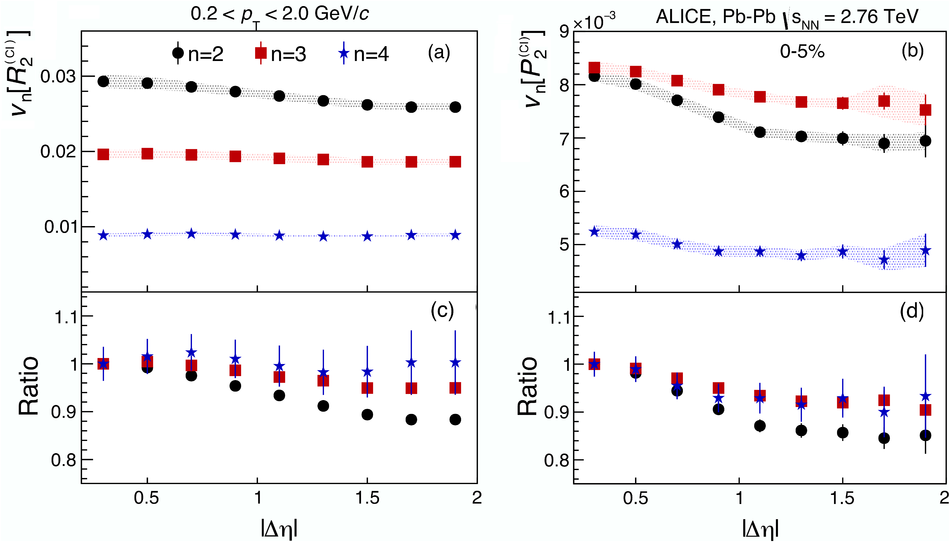 |
Figure 28
Coefficients $v_2$ (left) and $v_3$ (right) as a function of $|\Delta\eta|$ obtained from $P_2^{\rm CI}$ and $R_2^{\rm CI}$ correlation functions in the 70--80\% centrality interval in Pb--Pb collisions. Dotted lines show baselines drawn at $v_n$($|\Delta\eta|=1.75$). Vertical bars and shaded areas indicate statistical and systematic uncertainties, respectively. |  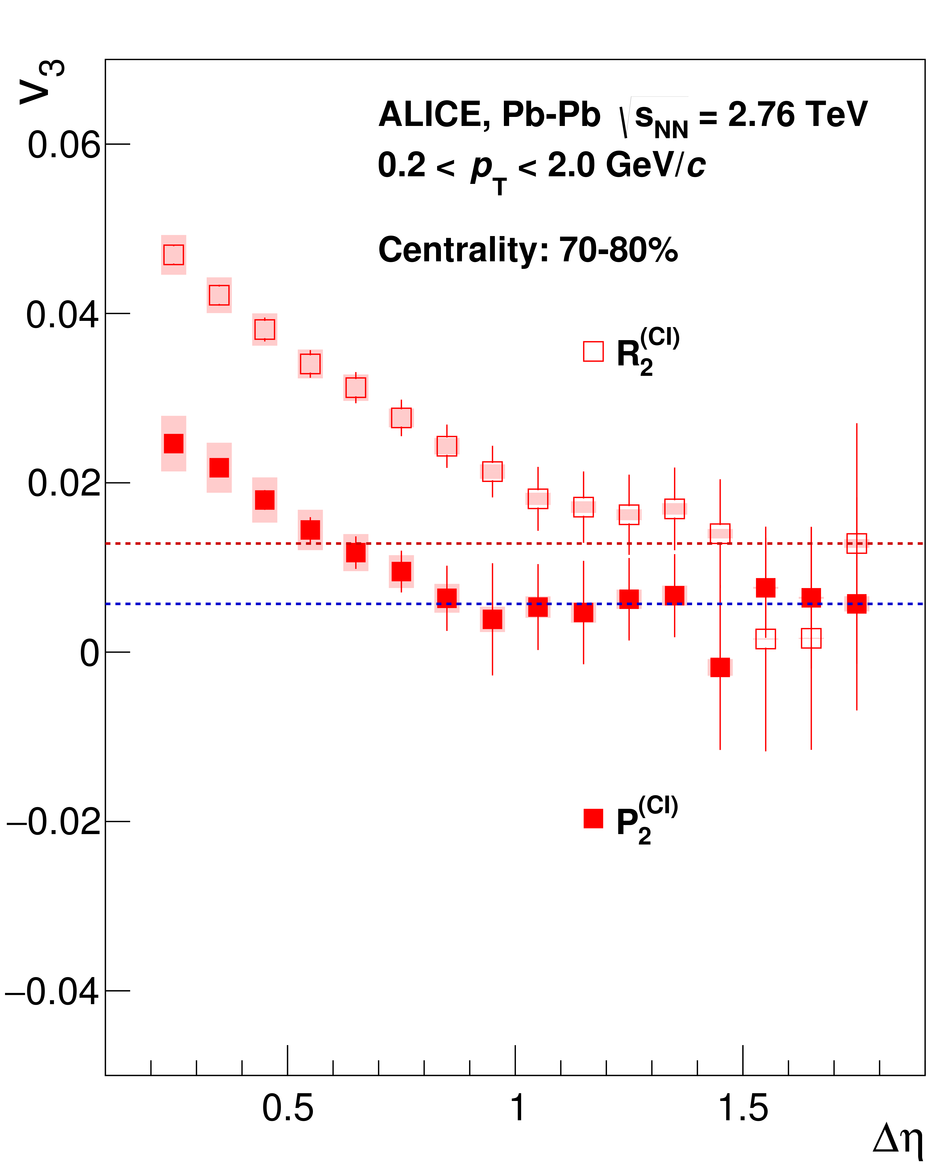 |
Figure 29
Fourier coefficients, $b_{n}$, $n = 1,...,4$, extracted from $R_{2}^{\rm (CI)}$ correlation functionsmeasured in \pPb\ collisions at$\snn = $ 5.02 TeV using three multiplicity classes. Vertical bars and shaded areas represent statistical and systematic uncertainties, respectively. |  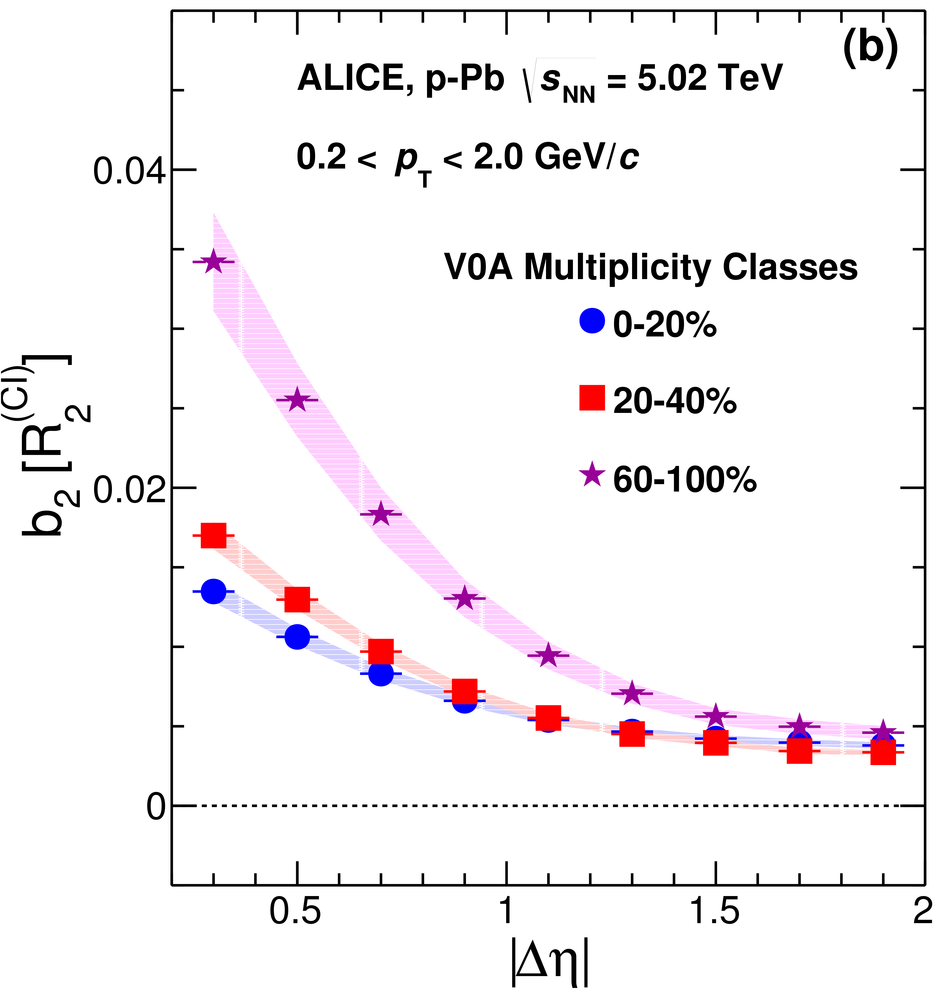 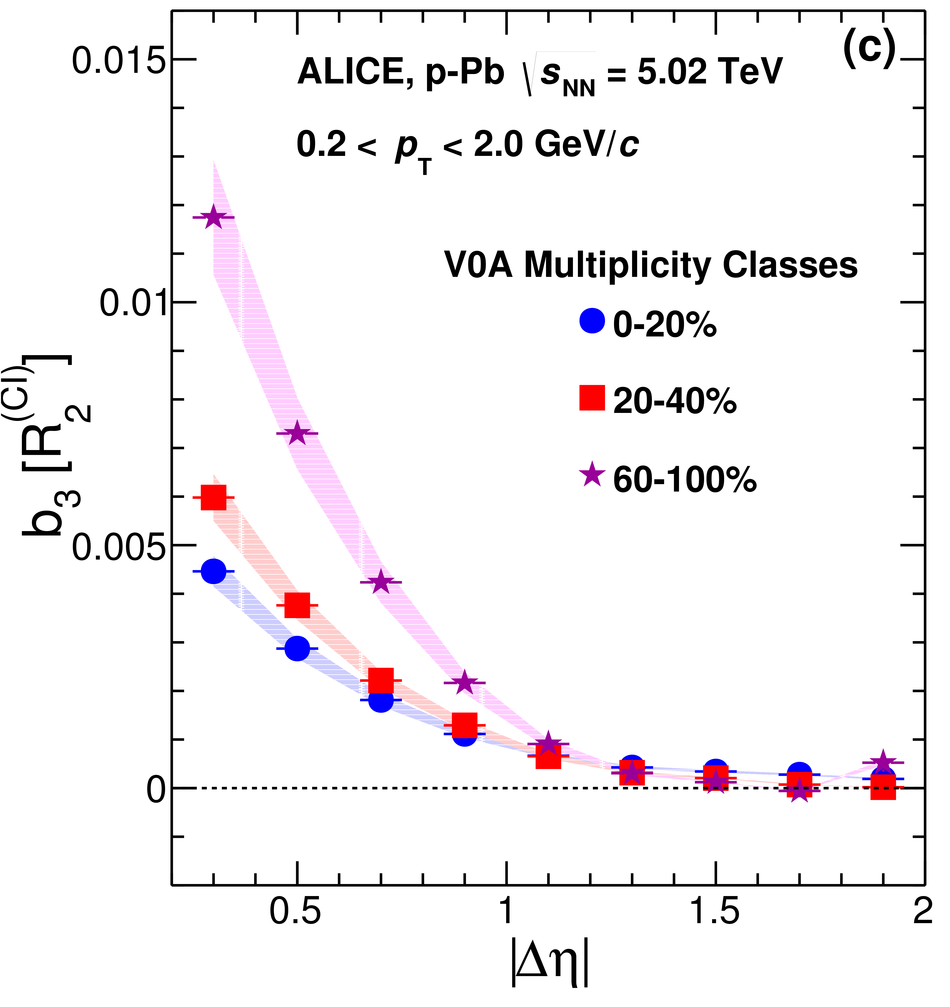 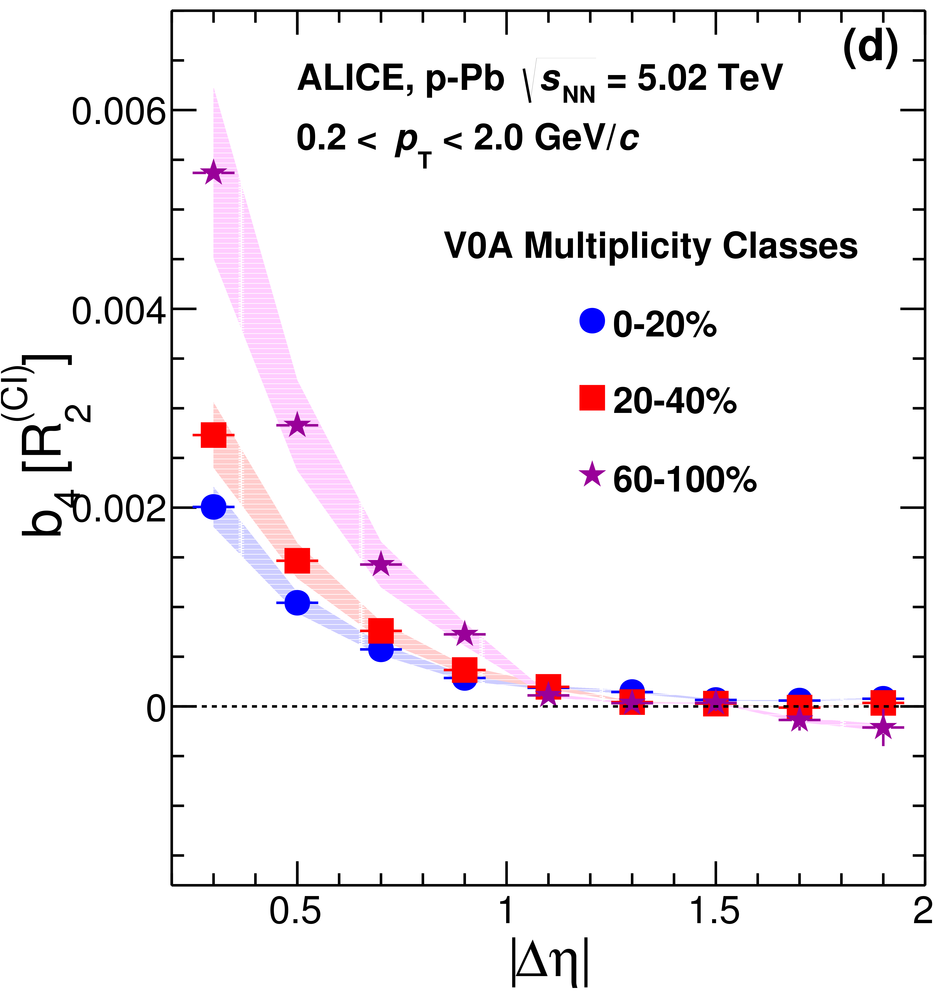 |
Figure 30
Fourier coefficients, $b_{n}$, $n = 1,...,4$, extracted from $P_{2}^{\rm (CI)}$ correlation functionsmeasured in \pPb\ collisions at$\snn = $ 5.02 TeV using three multiplicity classes. Vertical bars and shaded areas represent statistical and systematic uncertainties, respectively. | 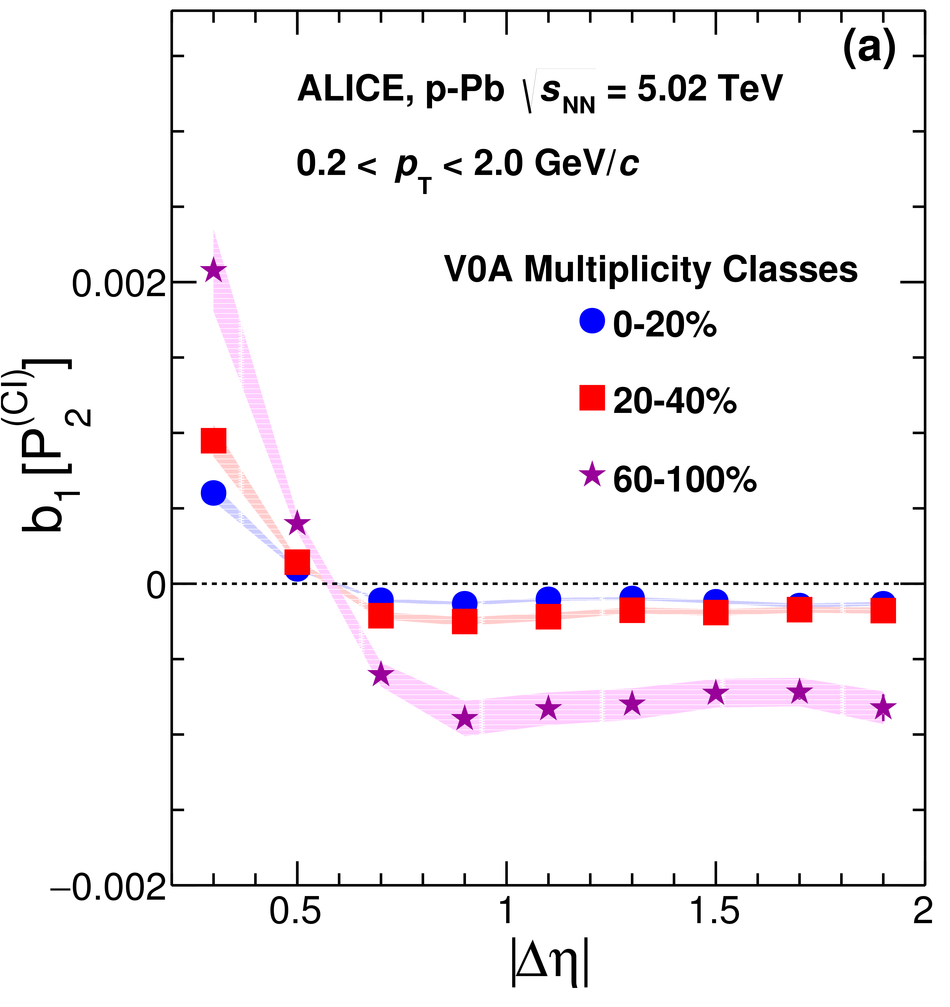 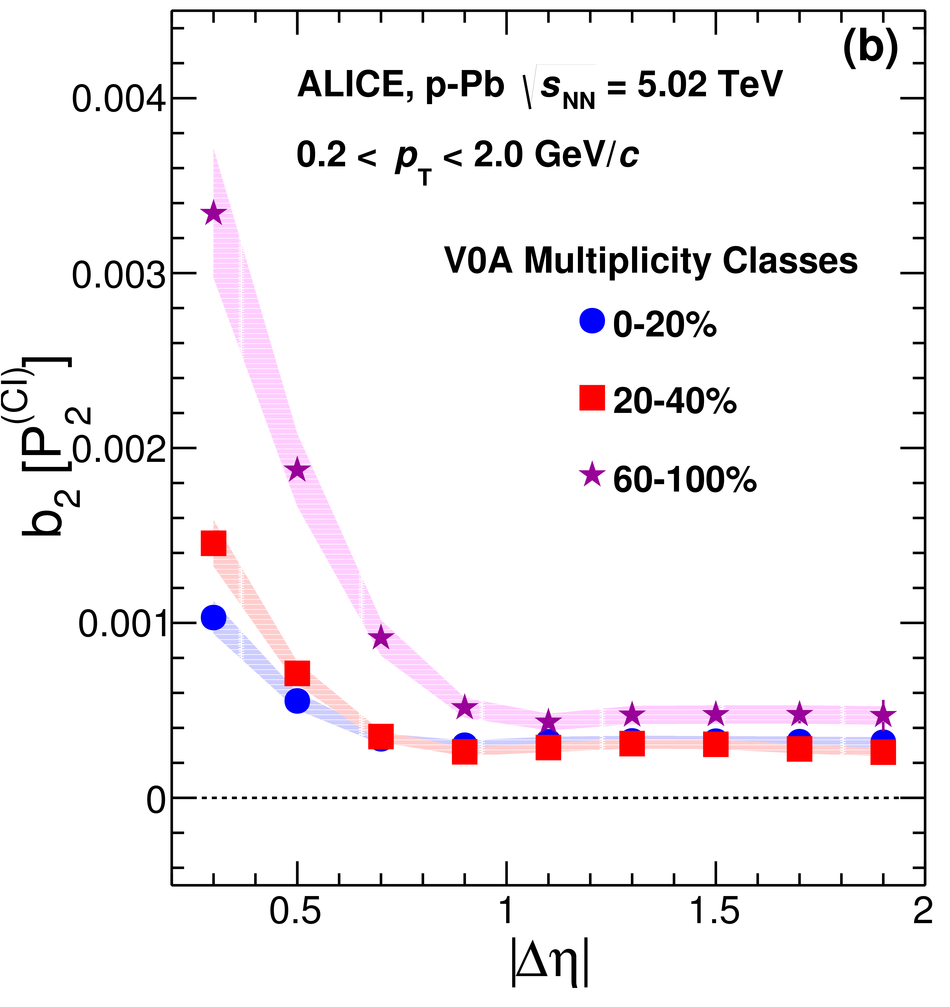 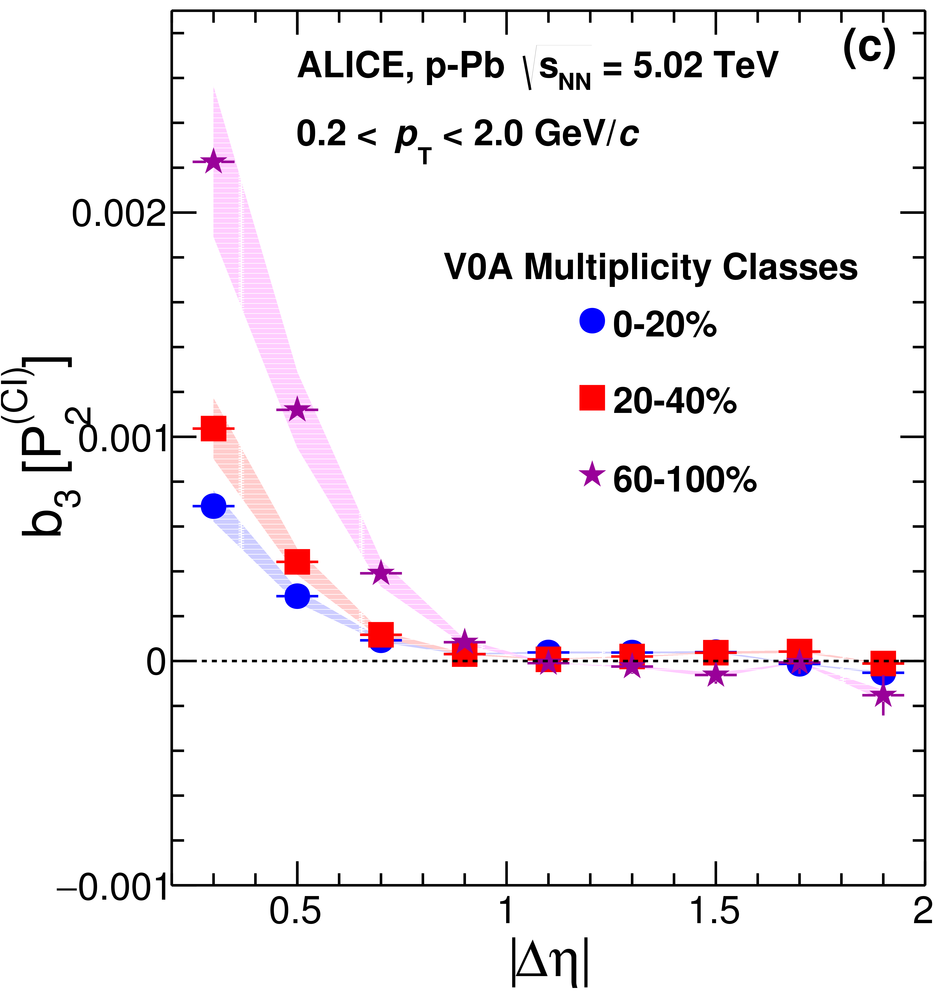 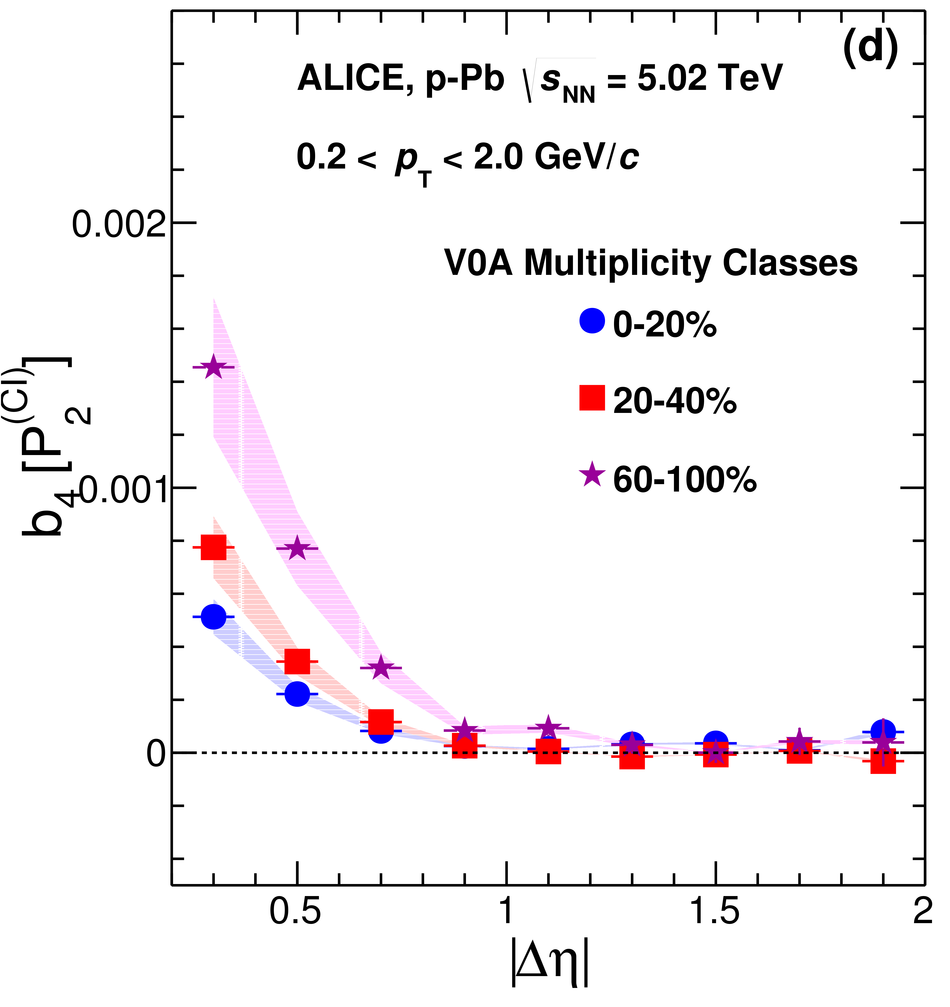 |
Figure 31
Fourier coefficient, $b_{n}$, $n=1, \ldots, 4$, measured in $R_{2}$ in 0--20\% multiplicity class in \pPb\ collisions at$\snn = $ 5.02 TeV. Vertical bars and shaded areas represent statistical and systematic uncertainties, respectively. | 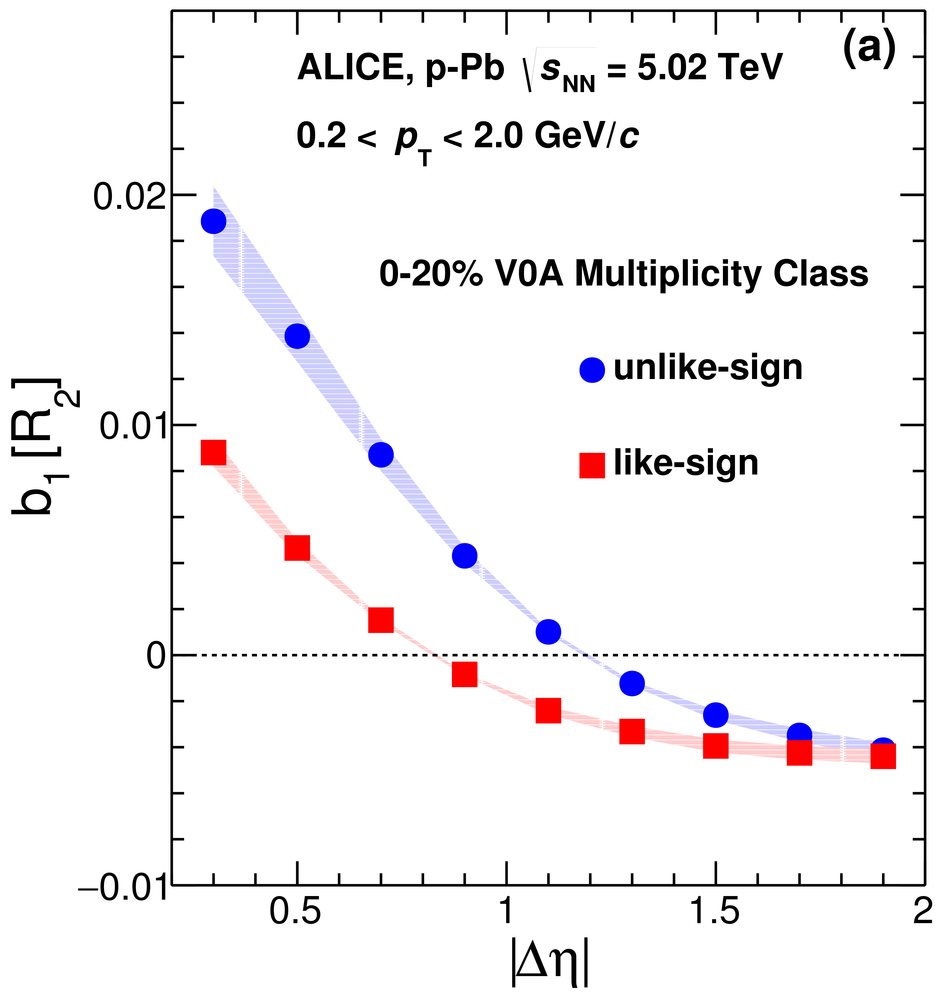  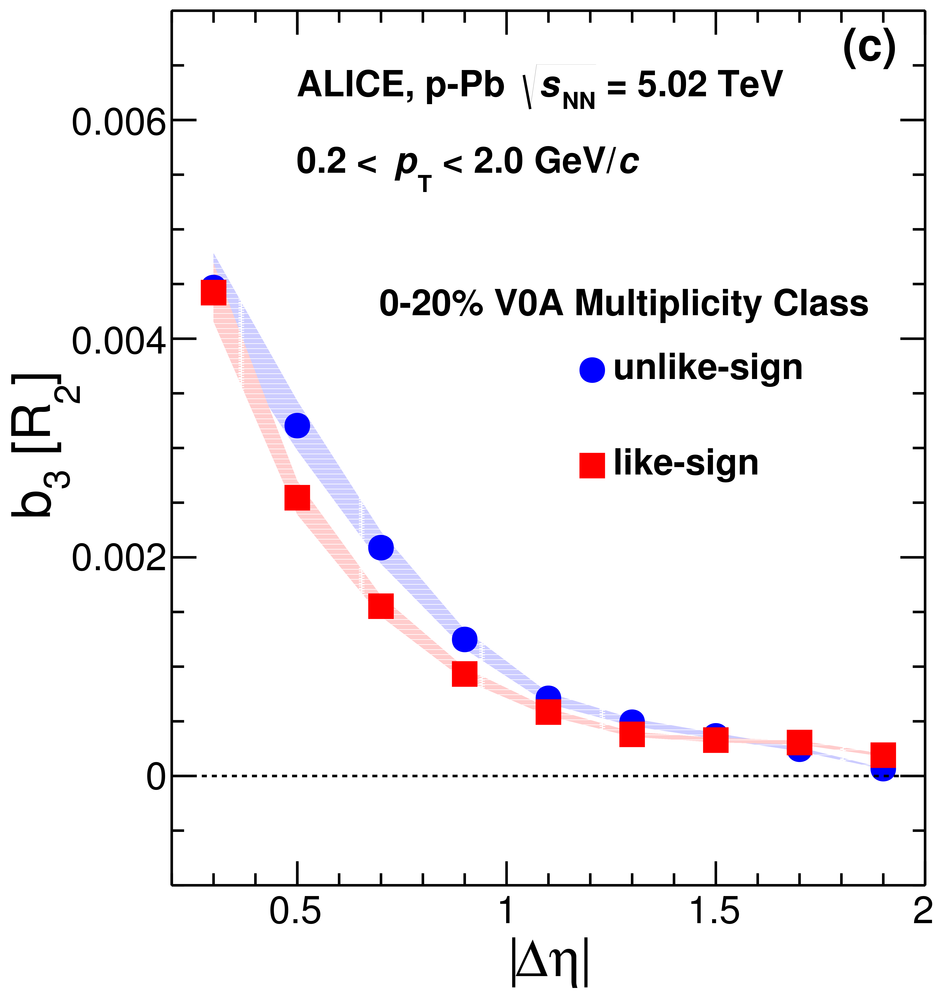 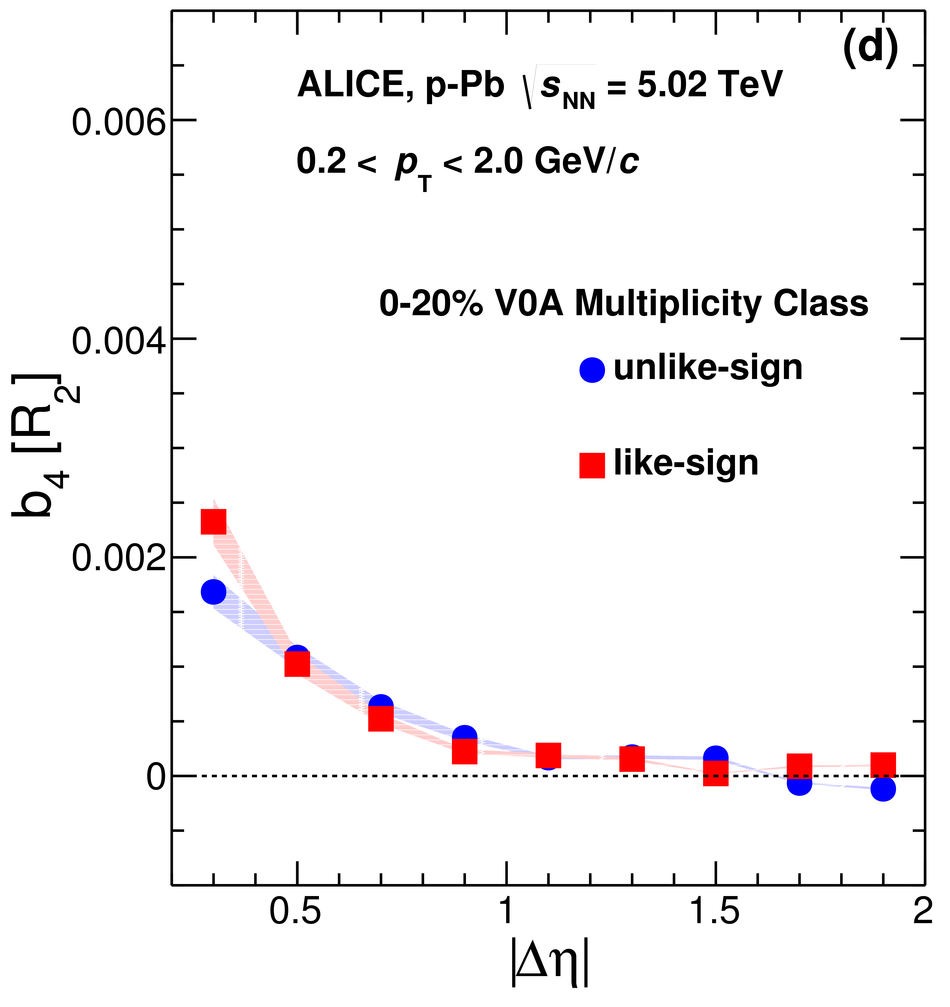 |
Figure 32
Fourier coefficient, $b_{n}$, $n=1, \ldots, 4$, measured in $P_{2}$ in 0--20\% multiplicity class in \pPb\ collisions at$\snn = $ 5.02 TeV. Vertical bars and shaded areas represent statistical and systematic uncertainties, respectively. | 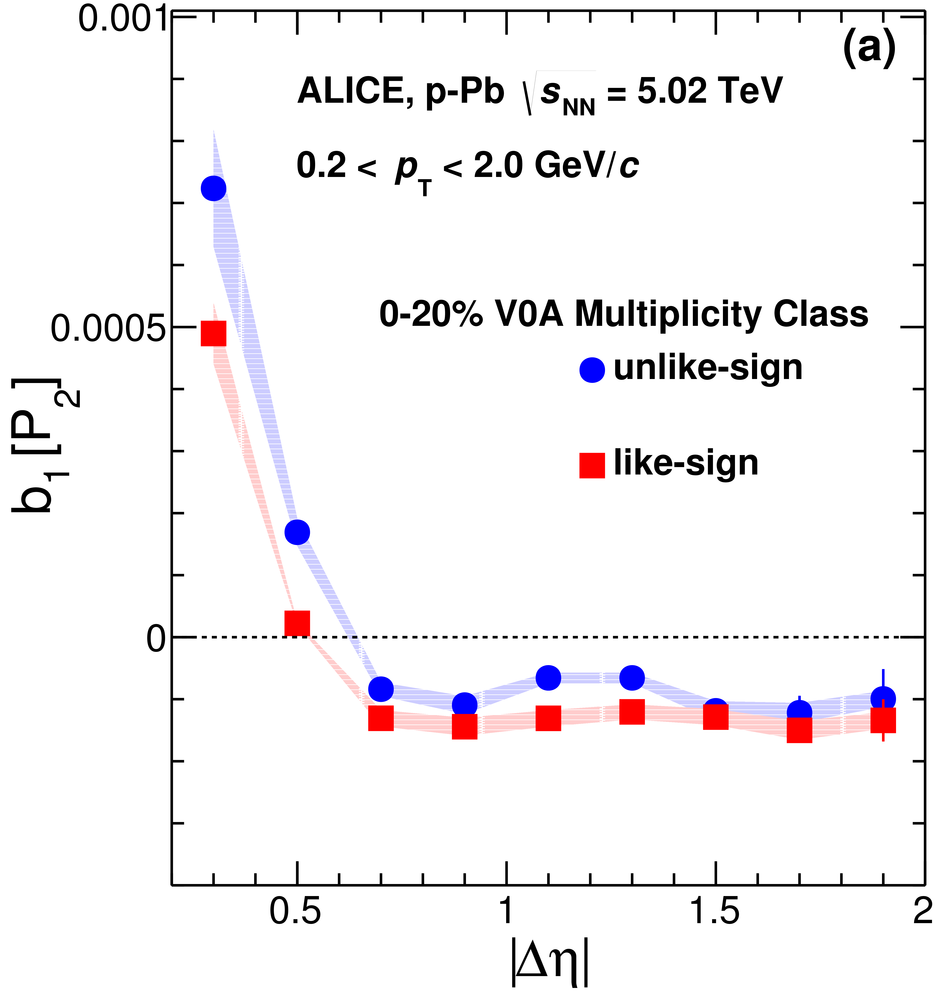 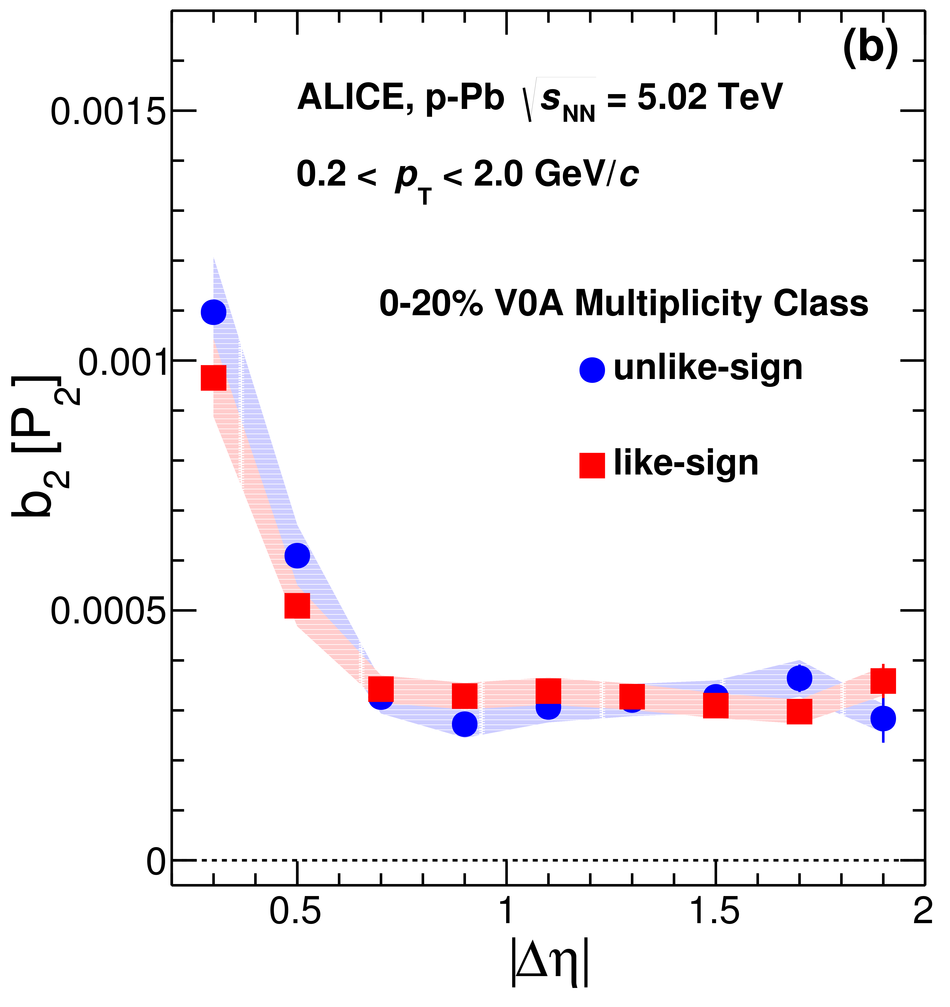  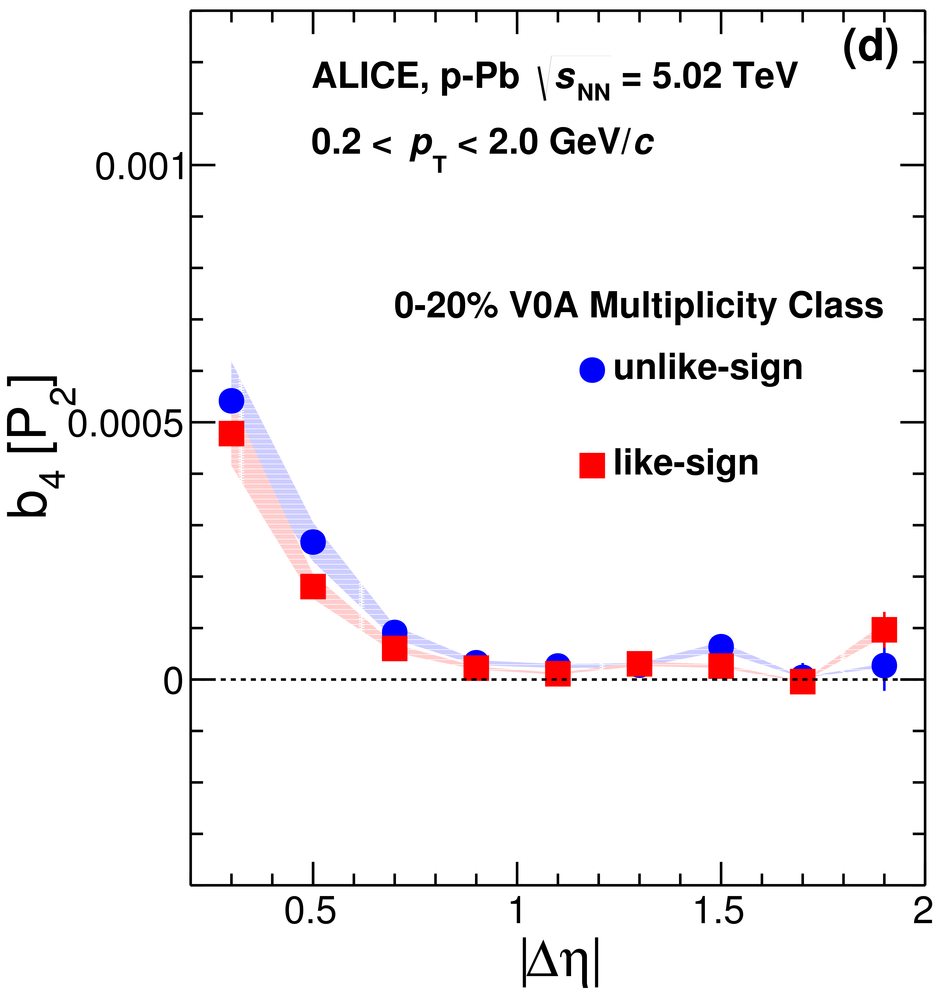 |