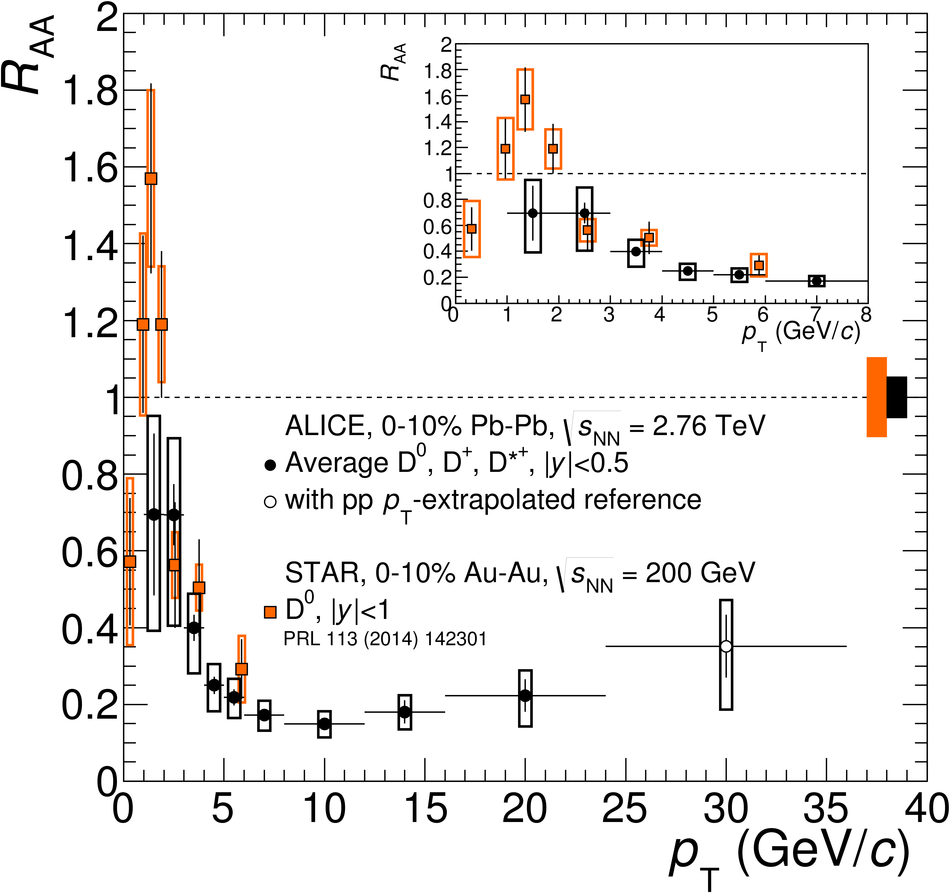
Left: prompt D-meson $\Raa$ (average of $\Dzero$, $\Dplus$ and $\Dstar$) as a function of $\pt$ in Pb-Pb collisions at $\snn=2.76 \rm TeV$ in the 0-10% and 30-50% centrality classes. Prompt D-meson nuclear modification factor (average of $\Dzero$, $\Dplus$ and $\Dstar$) as a function of $\pt$ in p-Pb collisions at $\sNN=5.02 \rm TeV$. Right: prompt D-meson $\Raa$ (average of $\Dzero$, $\Dplus$ and $\Dstar$) as a function of $\pt$ in the 10% most central Pb-Pb collisions at $\snn=2.76 \rm TeV$ compared to $\Dzero$ $\Raa$ measuredby the STAR Collaboration in Au-Au collisions at RHIC at $\snn=200 \rm GeV$. A zoomed-in plot of theinterval $0< \pt< 8 \rm{GeV}/c$ is shown in the inset. Statistical (bars), systematic (empty boxes), and normalisation (shaded boxes at $\Raa=1$) uncertainties are shown. Horizontal bars represent bin widths. Symbols are placed at the centre of the bin |  |