Comparison of femtoscopic radii, as a function of measured charged particle multiplicity, for a number of collision systems and collision energies Dashed lines show linear fits done to heavy-ion data, excluding ALICE (dotted lines show one sigma contour). Various experiments use differing \kt ranges, values shown on the plot are for the range for which the average \kt is closest to the selected value of $0.4$ GeV/$c$; in case of ALICE an average of two neighbouring ranges of \kt is shown. Systematic uncertainties are shown where available | 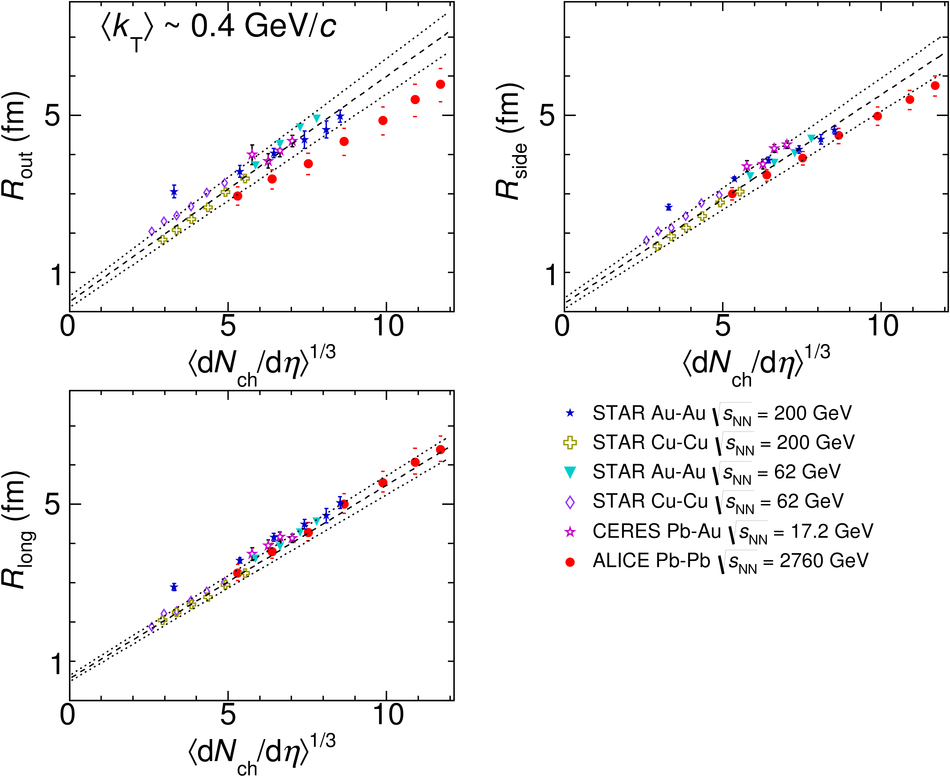 |