Femtoscopic radii as a function of pair transverse momentum \kt for seven centrality ranges. $R_{\rm out}$ is shown in (a), $R_{\rm side}$ in (b), $R_{\rm long}$ in (c) and $R_{\rm out}/R_{\rm side}$ in (d). The points for centralities 5--10\%, 10--20\%, 30--40\% and 40--50\% have been slightly shifted in the x direction for visibility. Statistical uncertainties are shown as black lines (usually smaller than symbol size), systematic uncertainties are shown as colored caps. | 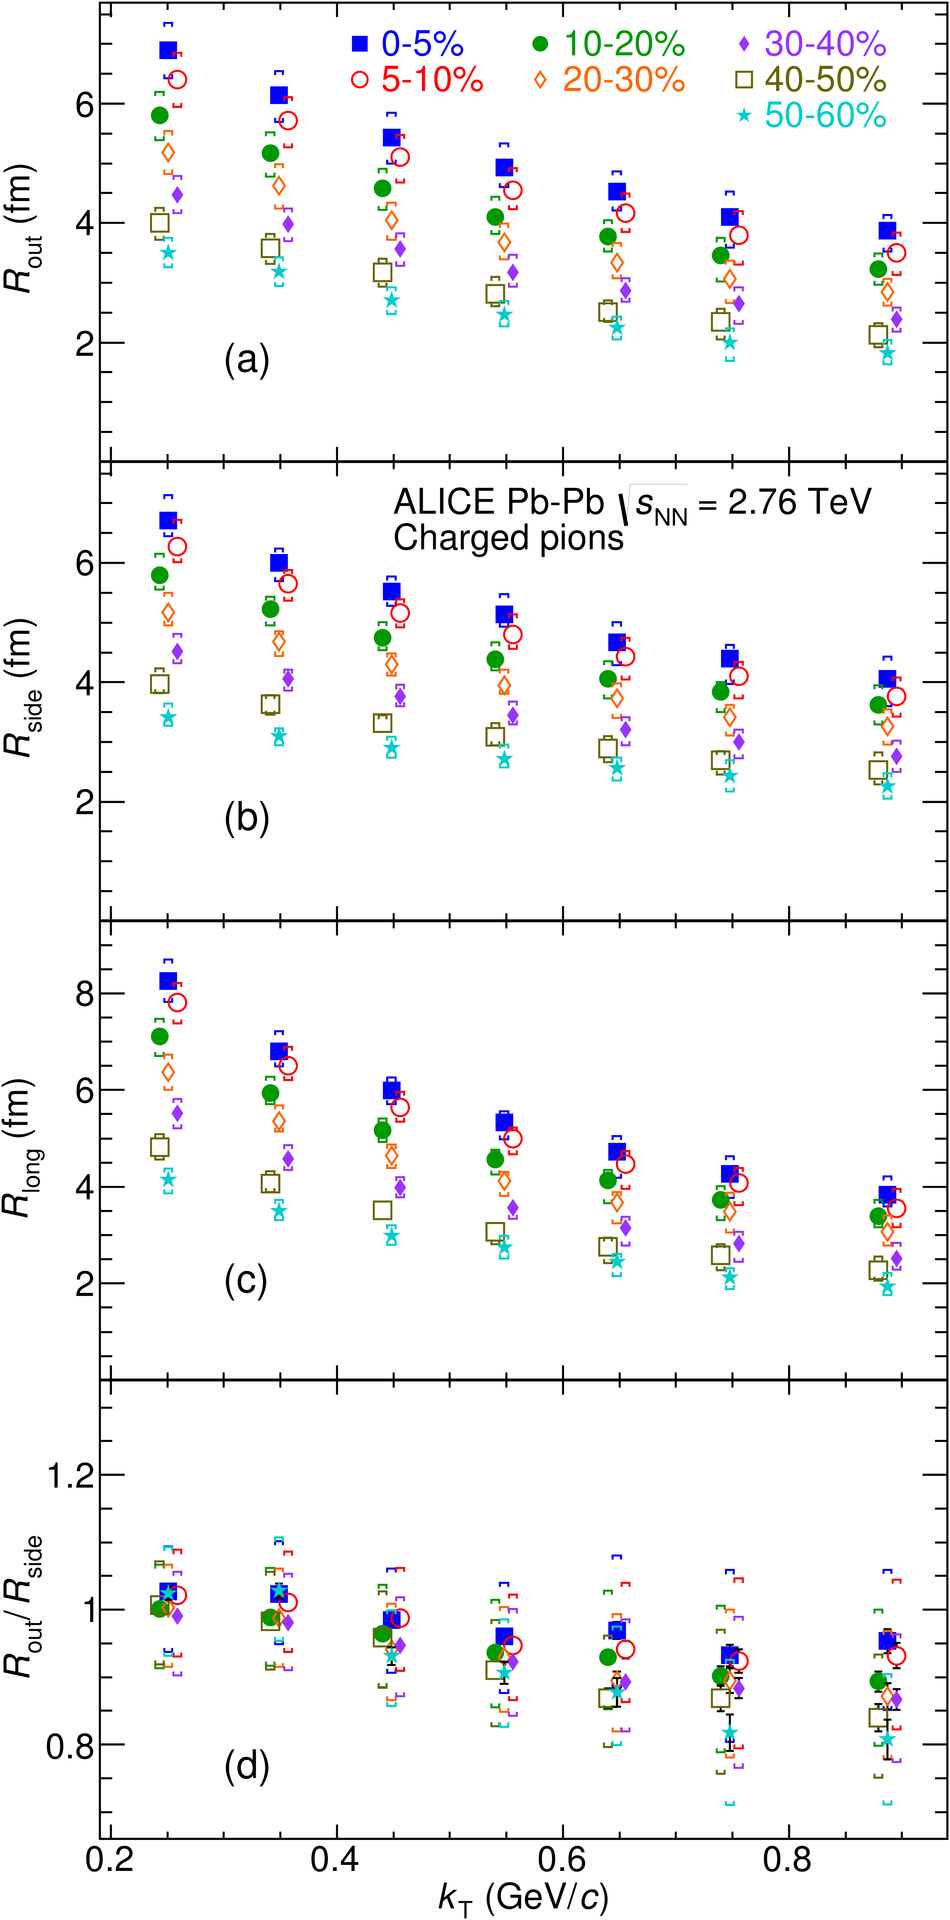 |