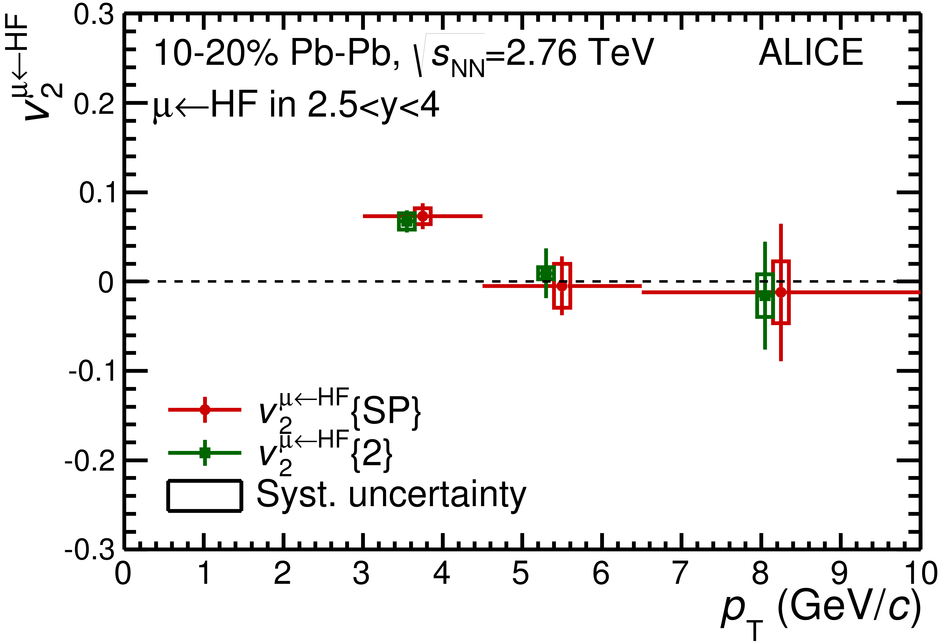
$p_{\rm T}$-differential elliptic flow of muons from heavy-flavour decays,$v_2^{\mu \leftarrow {\rm HF}}$, in $2.5 < y < 4$ and various centrality intervals, in Pb--Pb collisions at$\sqrt {s_{\rm NN}}$ = 2.76 TeV The symbols are placed at the centre of the $p_{\rm T}$ interval and, for visibility,the points from two-particle $Q$ cumulants and Lee-Yang zeros with product generating function are shifted horizontally The meaning of the symbols is the same as in Fig.[1] The horizontal error bars are not plotted for shifted data points The $p_{\rm T}$ intervals used with the Lee-Yang zeros method are different with respect to the other methods Upper panels: results from two-particle correlation flow methods (scalar product and two-particle $Q$ cumulants) in the 0-10% (left) and 10-20% (right) centrality intervals Lower panels: results in the 20-40% centrality interval from two-particle correlation flow methods (scalar product and two-particle $Q$ cumulants) and from four-particle $Q$ cumulants (left), and from four-particle $Q$ cumulants and Lee-Yang zeros (right) See the text for details. |  |