The production of charged pions, kaons and (anti)protons has been measured at mid-rapidity ($-0.5 <~ y <~ 0$) in p-Pb collisions at $\sqrt{s_{\rm NN}}=5.02$ TeV using the ALICE detector at the LHC. Exploiting particle identification capabilities at high transverse momentum ($p_{\rm T}$), the previously published $p_{\rm T}$ spectra have been extended to include measurements up to 20 GeV/$c$ for seven event multiplicity classes. The $p_{\rm T}$ spectra for pp collisions at $\sqrt{s}=7$ TeV, needed to interpolate a pp reference spectrum, have also been extended up to 20 GeV/$c$ to measure the nuclear modification factor ($R_{\rm pPb}$) in non-single diffractive p-Pb collisions. At intermediate transverse momentum ($2 <~ p_{\rm T} <~ 10$\,GeV/$c$) the proton-to-pion ratio increases with multiplicity in p-Pb collisions, a similar effect is not present in the kaon-to-pion ratio. The $p_{\rm T}$ dependent structure of such increase is qualitatively similar to those observed in pp and heavy-ion collisions. At high $p_{\rm T}$ ($>10$ GeV/$c$), the particle ratios are consistent with those reported for pp and Pb-Pb collisions at the LHC energies. At intermediate $p_{\rm T}$ the (anti)proton $R_{\rm pPb}$ shows a Cronin-like enhancement, while pions and kaons show little or no nuclear modification. At high $p_{\rm T}$ the charged pion, kaon and (anti)proton $R_{\rm pPb}$ are consistent with unity within statistical and systematic uncertainties.
Phys. Lett. B 760 (2016) 720
HEP Data
e-Print: arXiv:1601.03658 | PDF | inSPIRE
CERN-EP-2016-003
Figure 2
Distributions of the Cherenkov angle measured in the HMPID for positive tracks having $p_{\rm{T}}$ between 2.5-2.6 GeV/$c$ (left) and between 3.8-4.0 GeV/$c$ (right), in p-Pb collisions at $\sqrt{s_{\rm NN}} = 5$.02 TeV for the 0-5% V0A multiplicity class (see the text for further details). | 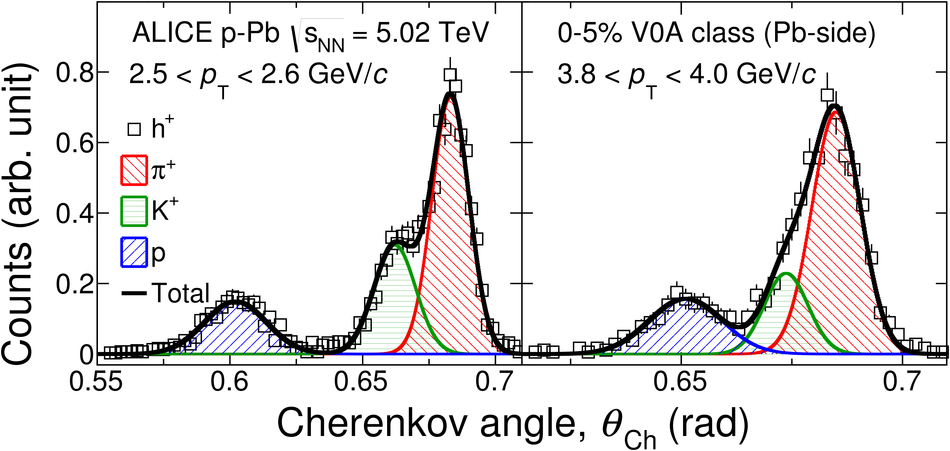 |
Figure 3
Specific energy loss, ${\text{d}E/\text{d}x}$, as a function of momentum $p$ in the pseudorapidity range $-0.5 < \eta < -0.375$ for minimum bias p-Pb collisions. In each momentum bin the ${\text{d}E/\text{d}x}$ spectra have been normalized to have unit integrals and only bins with more than 2% of the counts are shown (making electrons not visible in the figure, except at very low momentum). The curves show the $\langle {\text{d}E/\text{d}x} \rangle$ response for pions, kaons, protons and electrons. | 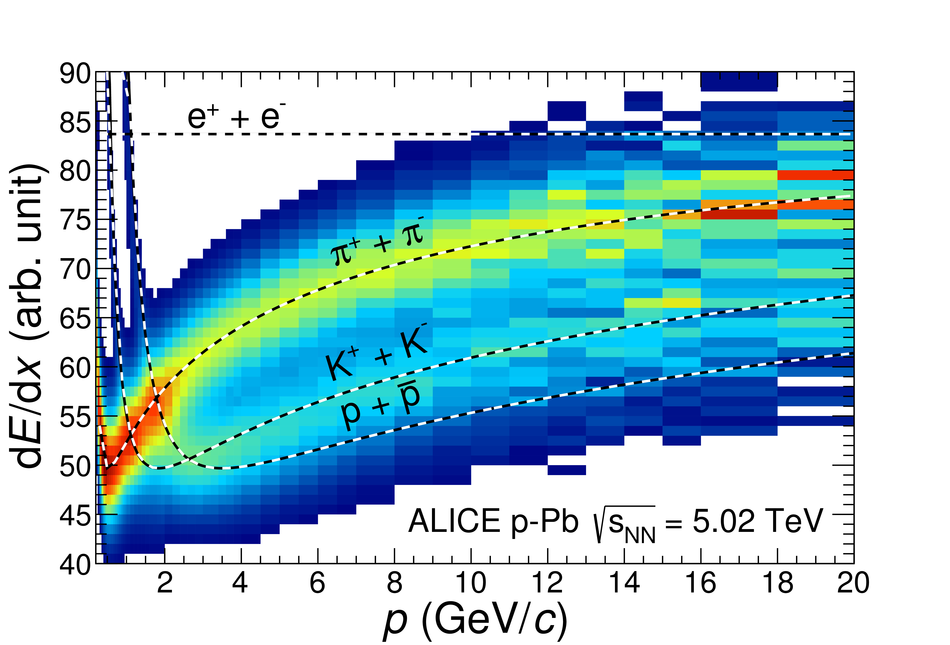 |
Figure 5
Four-Gaussian fits (lines) to the ${\text{d}E/\text{d}x}$ spectra (markers) for tracks having momentum $3.4 < p < 3.6$ GeV/$c$ (top row) and $8.0 < p < 9.0$ GeV/$c$ (bottom row) within $-0.125 < \eta < 0$. All of the spectra are normalized to have unit integrals. Columns refer to different V0A multiplicity classes. Individual signals of charged pions, kaons, and (anti)protons are shown as red, green, and blue dashed areas, respectively. The contribution of electrons is not visible and is negligible (< 1%). | 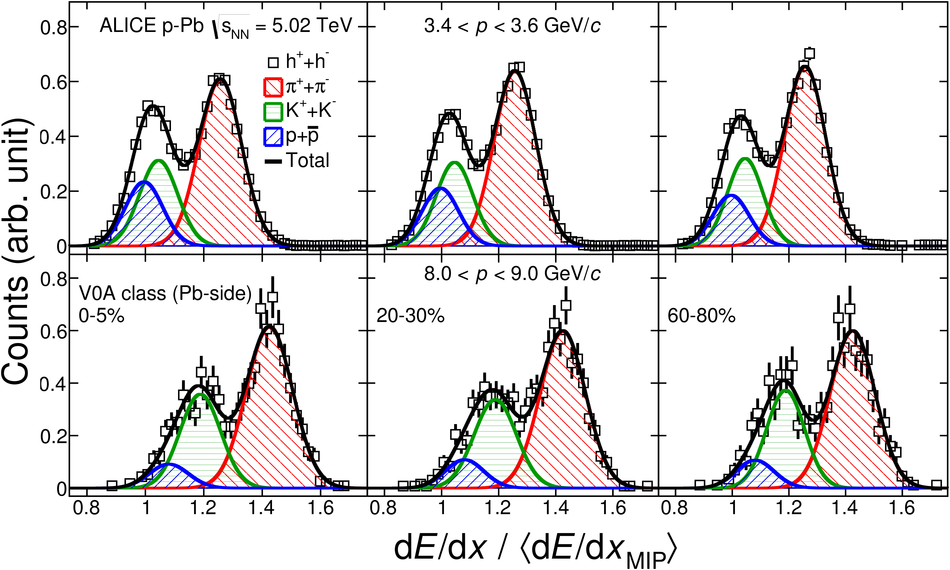 |
Figure 6
The ratio of individual spectra to the combined spectrum as a function of $p_{\rm T}$ for pions (left), kaons (middle), and protons (right). From top-to-bottom the rows show the V0A multiplicity class 0-5%, 20-40% and 60-80%. Statistical and uncorrelated systematic uncertainties are shown as vertical error bars and error bands, respectively. Only the $p_{\rm T}$ ranges where individual analysis overlap are shown. See the text for further details. | 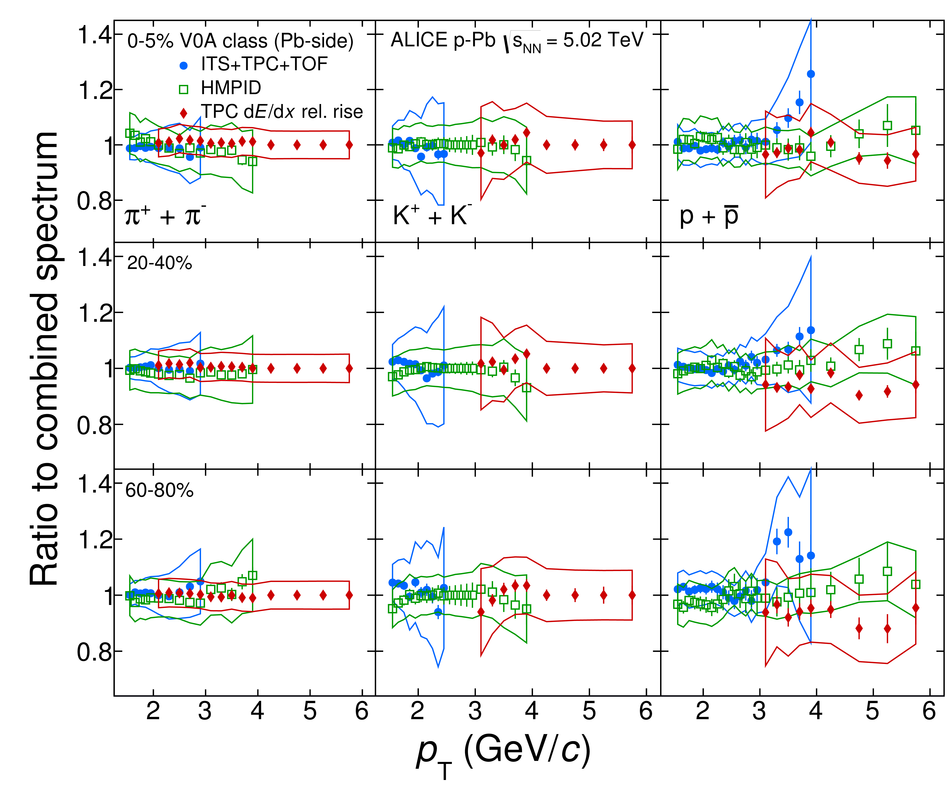 |
Figure 7
Transverse momentum spectra of charged pions (left), kaons (middle), and (anti)protons (right) measured in p-Pb collisions at $\sqrt{s_{\rm NN}} = 5.02$ TeV. Statistical and systematic uncertainties are plotted as vertical error bars and boxes, respectively. The spectra (measured for NSD events and for different V0A multiplicity classes) have been scaled by the indicated factors in the legend for better visibility. | 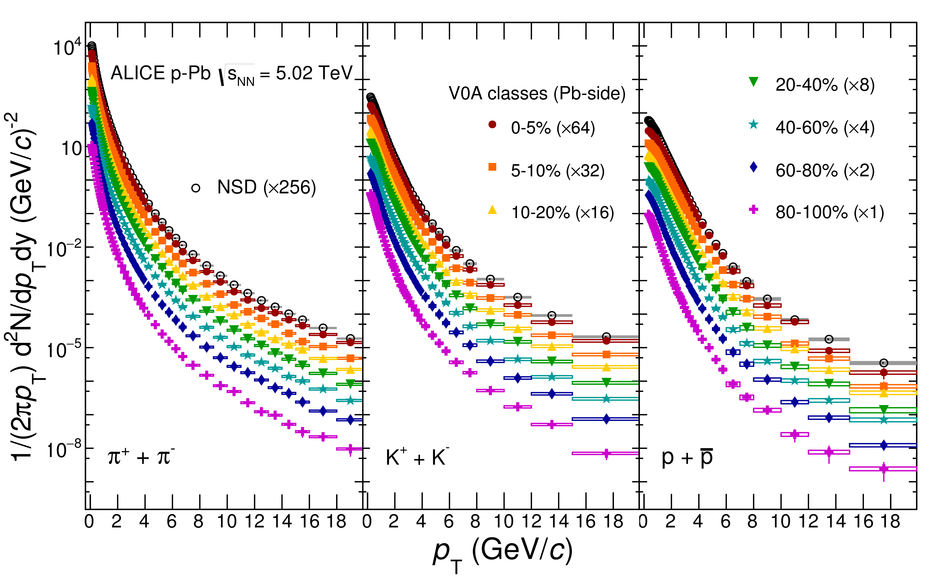 |
Figure 8
Transverse momentum spectra of charged pions (left), kaons (middle), and (anti)protons (right) measured in INEL pp collisions at $\sqrt{s} = 2.76$ TeV and at $\sqrt{s} = 7$ TeV. Statistical and systematic uncertainties are plotted as vertical error bars and boxes, respectively. The spectrum at $\sqrt{s} = 5.02$ TeV represents the reference in INEL pp collisions, constructed from measured spectra at $\sqrt{s} = 2.76$ TeV and at $\sqrt{s} = 7$ TeV. See the text for further details. Panels on the bottom show the ratio of the measured yields to the interpolated spectra. Only uncertainties of the interpolated spectra are shown. | 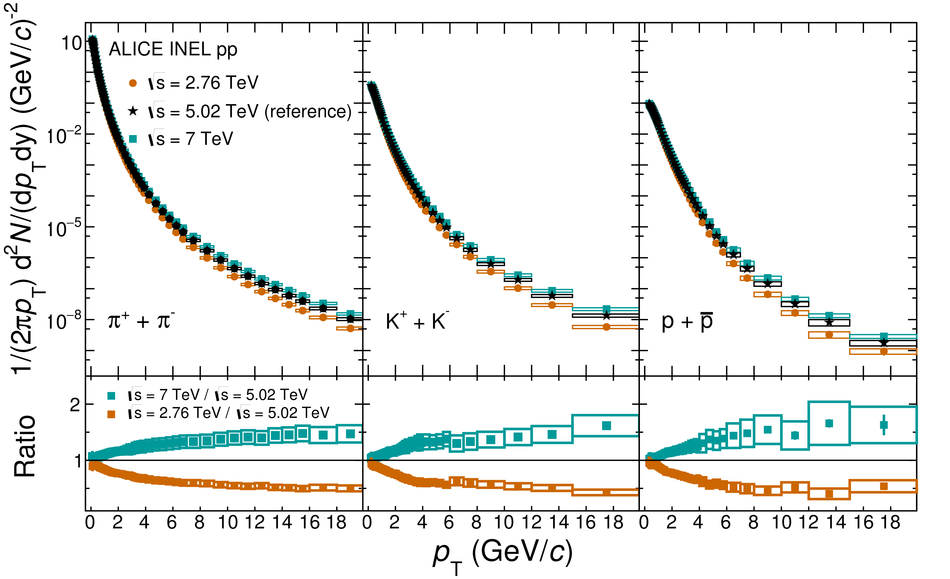 |
Figure 9
The nuclear modification factor $R_{\rm pPb}$ as a function of transverse momentum $p_{\rm T}$ for different particle species. The statistical and systematic uncertainties are shown as vertical error bars and boxes, respectively. The total normalization uncertainty is indicated by a vertical scale of the empty box at $p_{\rm T} = \text{0 GeV/}c$ and $R_{\rm pPb} = \text{1}$. The result for inclusive charged hadrons is also shown. | 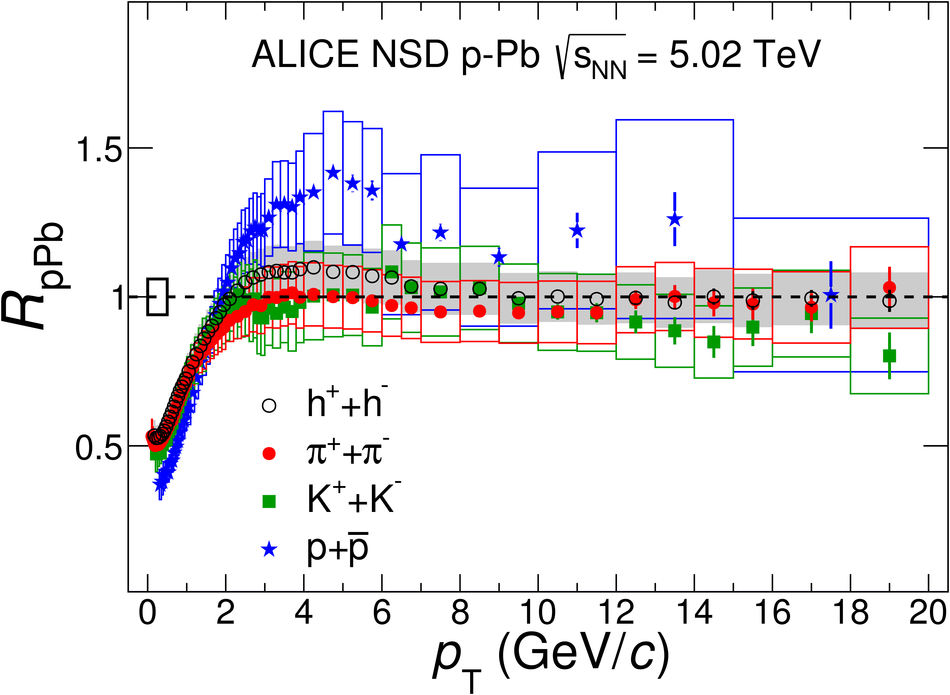 |
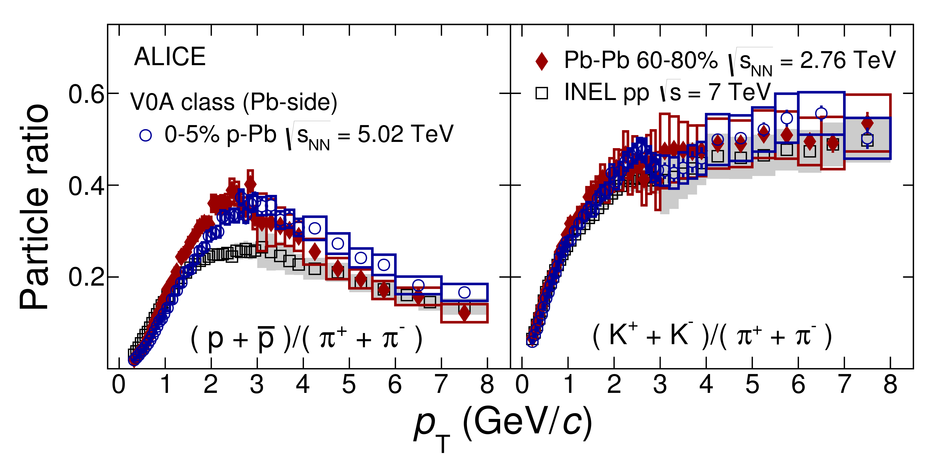
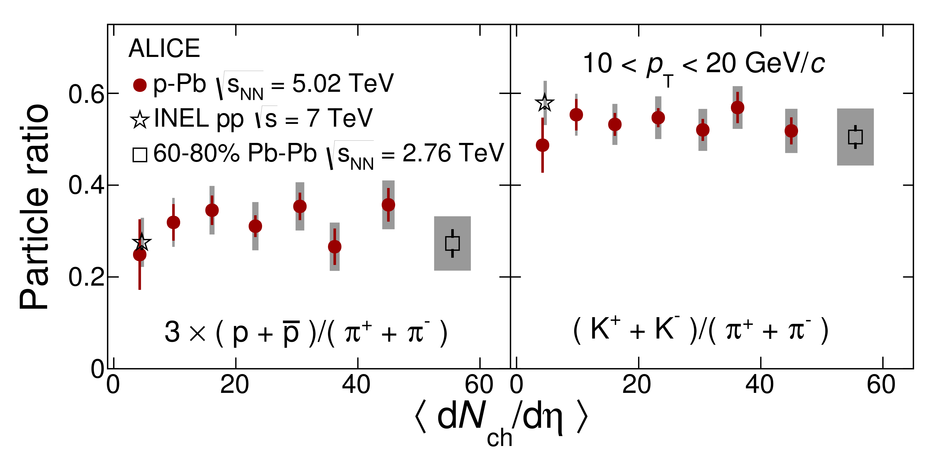
Figure 10
Kaon-to-pion (upper panel) and proton-to-pion (bottom panel) ratios as a function of $p_{\rm T}$ for different V0A multiplicity classes. Results for p-Pb collisions (full markers) are compared to the ratios measured in INEL pp collisions at 2.76 TeV (empty circles) and at 7 TeV (full circles). The statistical and systematic uncertainties are plotted as vertical error bars and boxes, respectively. | 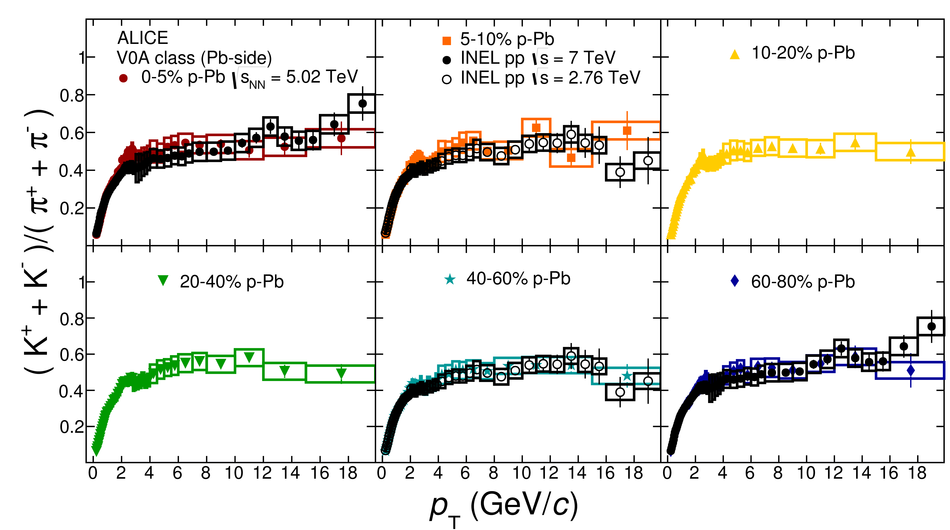 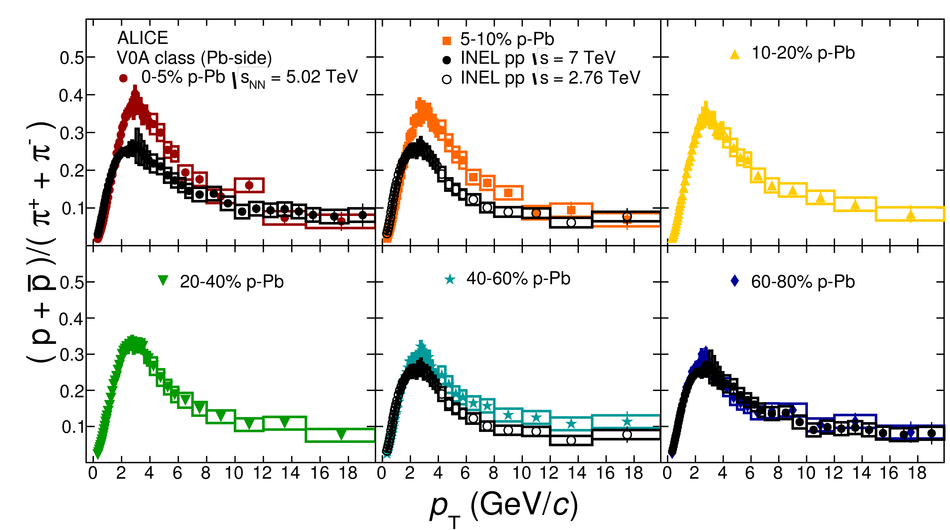 |