Direct photon production in Pb-Pb collisions at $\sqrt{s_\rm{NN}}$ = 2.76 TeV

Direct photon production at mid-rapidity in Pb-Pb collisions at $\sqrt{s_{_{\mathrm{NN}}}} = 2.76$ TeV was studied in the transverse momentum range $0.9 <~ p_\mathrm{T} <~ 14$ GeV$/c$. Photons were detected with the highly segmented electromagnetic calorimeter PHOS and via conversions in the ALICE detector material with the $e^+e^-$ pair reconstructed in the central tracking system. The results of the two methods were combined and direct photon spectra were measured for the 0-20%, 20-40%, and 40-80% centrality classes. For all three classes, agreement was found with perturbative QCD calculations for $p_\mathrm{T} \gtrsim 5$ GeV$/c$. Direct photon spectra down to $p_\mathrm{T} \approx 1$ GeV$/c$ could be extracted for the 20-40% and 0-20% centrality classes. The significance of the direct photon signal for $0.9 <~ p_\mathrm{T} <~ 2.1$ GeV$/c$ is $2.6\sigma$ for the 0-20% class. The spectrum in this $p_\mathrm{T}$ range and centrality class can be described by an exponential with an inverse slope parameter of $(297 \pm 12^\mathrm{stat}\pm 41^\mathrm{syst})$ MeV. State-of-the-art models for photon production in heavy-ion collisions agree with the data within uncertainties.


Phys. Lett. B 754 (2016) 235-248
HEP Data
e-Print: arXiv:1509.07324 | PDF | inSPIRE
CERN-PH-EP-2015-254

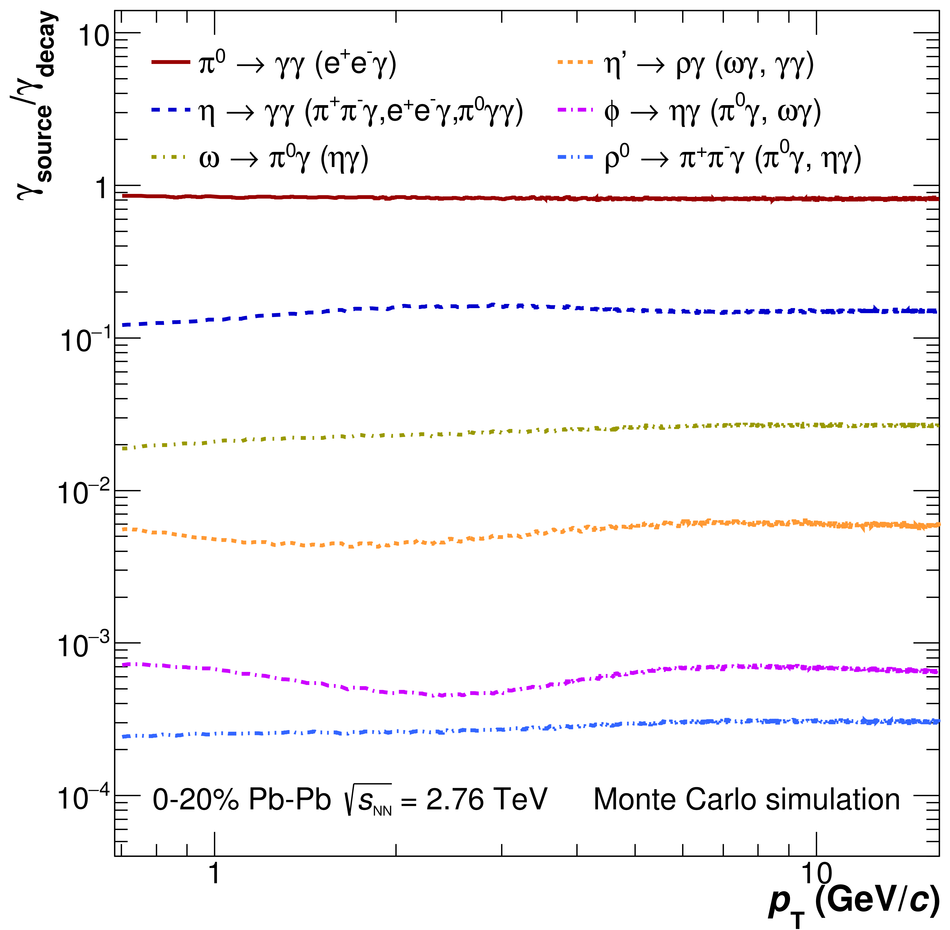
Figure 1

Relative contributions of different hadrons to the total decay photon spectrum as a function of the decay photon transverse momentum (PCM case)

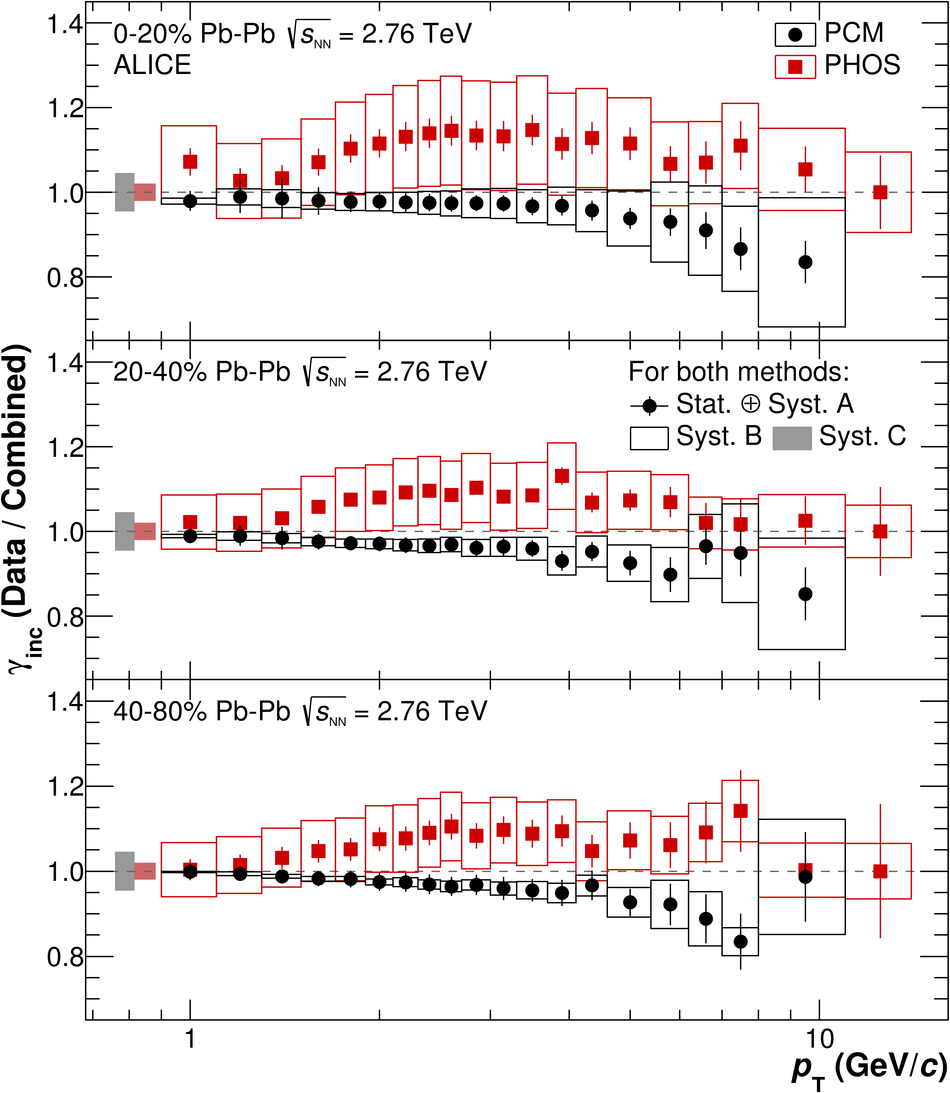
Figure 2

Comparison of inclusive photon spectra measured with PCM and PHOS in the 0-20%, 20-40%, and 40-80% centrality classes. The individual spectra were divided by the corresponding combined PCM and PHOS spectrum. The shown errors only reflect the uncertainties of the individual measurements. The boxes around unity indicate normalization uncertainties (type C)

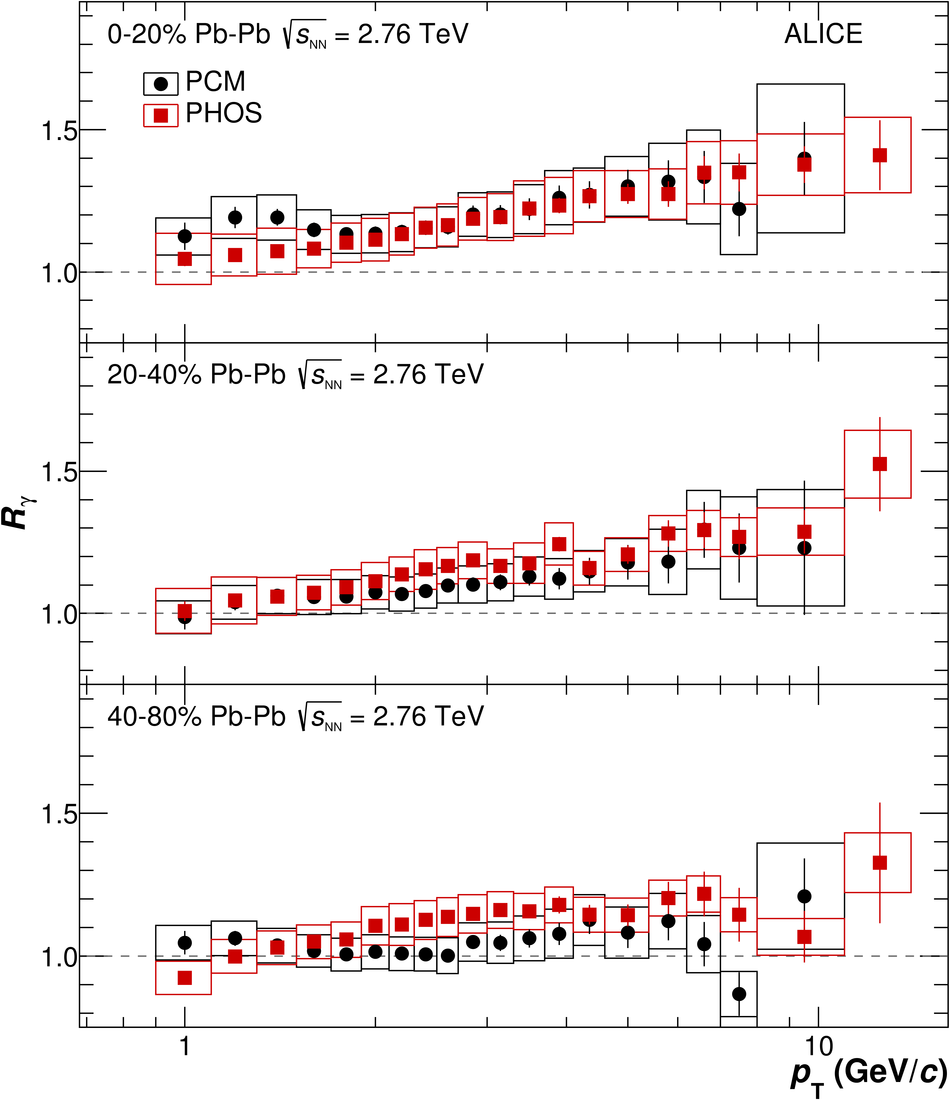
Figure 3

Comparison of double ratios $R_\gamma$ measured with PCM and PHOS for the 0-20%, 20-40%, and 40-80% centrality classes. Error bars reflect the statistical and type A systematic uncertainty, the boxes represent the type B and C systematic uncertainties. The cancellation of uncertainties (energy scale, material budget) in the double ratio $R_\gamma$ is taken into account in the shown systematic uncertainties.

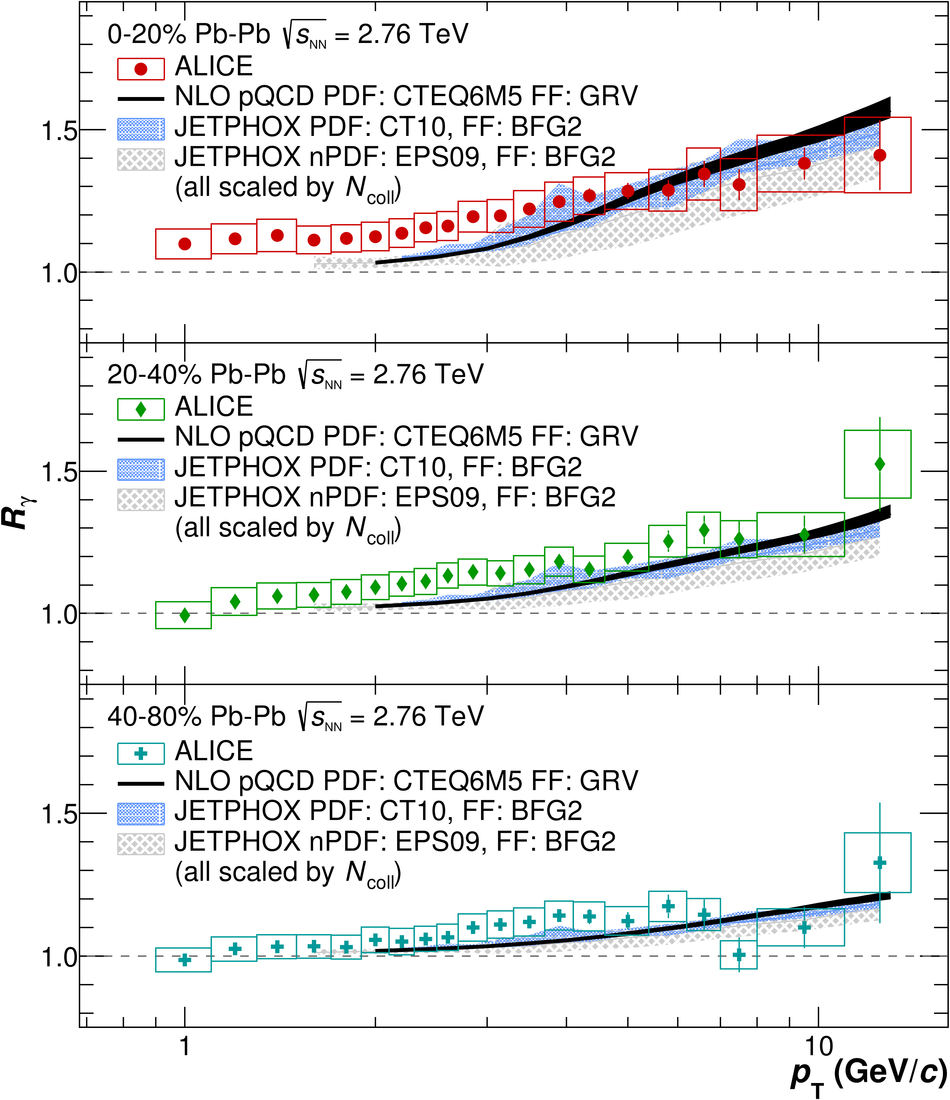
Figure 4

Combined PCM and PHOS double ratio $R_\gamma$ in the 0-20%, 20-40%, and 40-80% centrality classes compared with pQCD calculations for nucleon-nucleon collisions scaled by the number of binary collisions for the corresponding Pb-Pb centrality class. The dark blue curve is a calculation from Refs [51,52]. which uses the GRV photon fragmentation function [53]. The JETPHOX calculations were performed with two different parton distribution functions, CT10 [55] and EPS09 [56], and the BFG II fragmentation function [57].

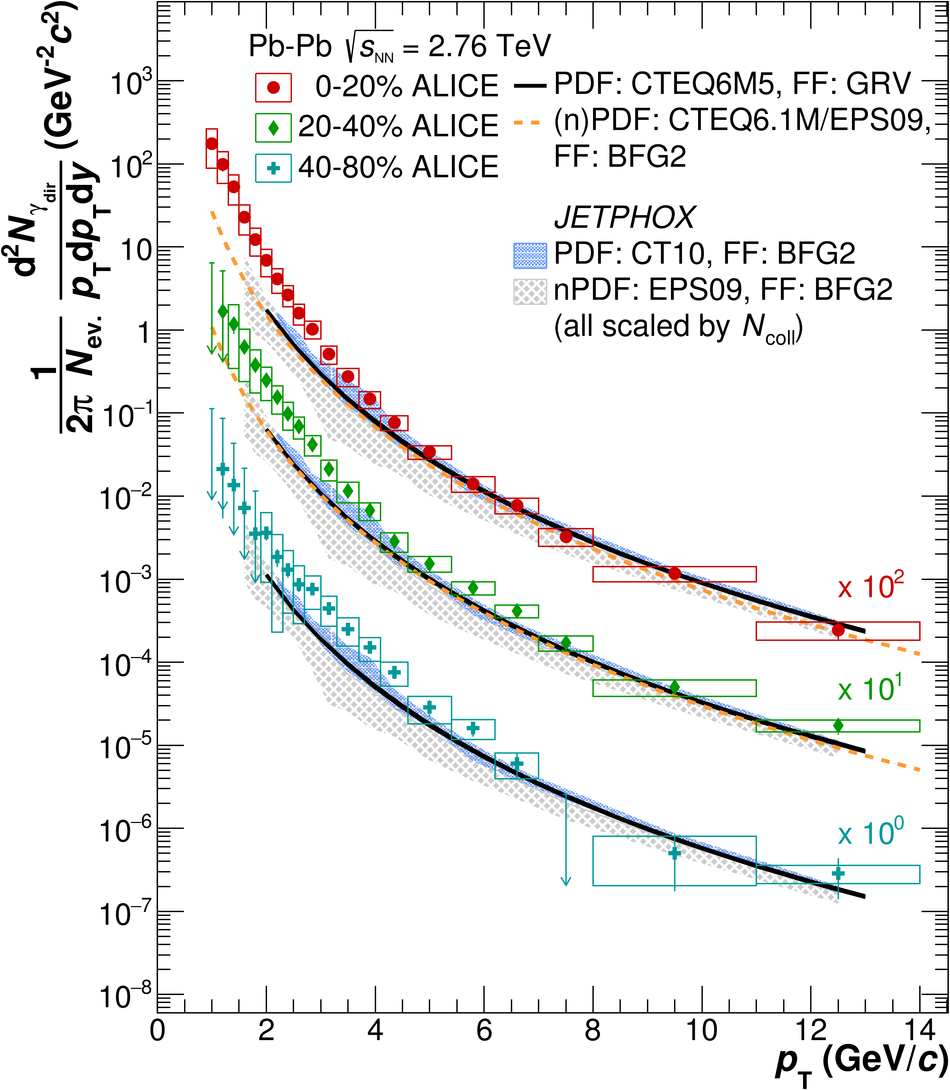
Figure 5

Direct photon spectra in Pb-Pb collisions at $\snn$=2.76 TeV for the 0-20% (scaled by a factor 100), the 20-40% (scaled by a factor 10) and 40-80% centrality classes compared to NLO pQCD predictions for the direct photon yield in pp collisions at the same energy, scaled by the number of binary nucleon collisions for each centrality class.

Figure 6

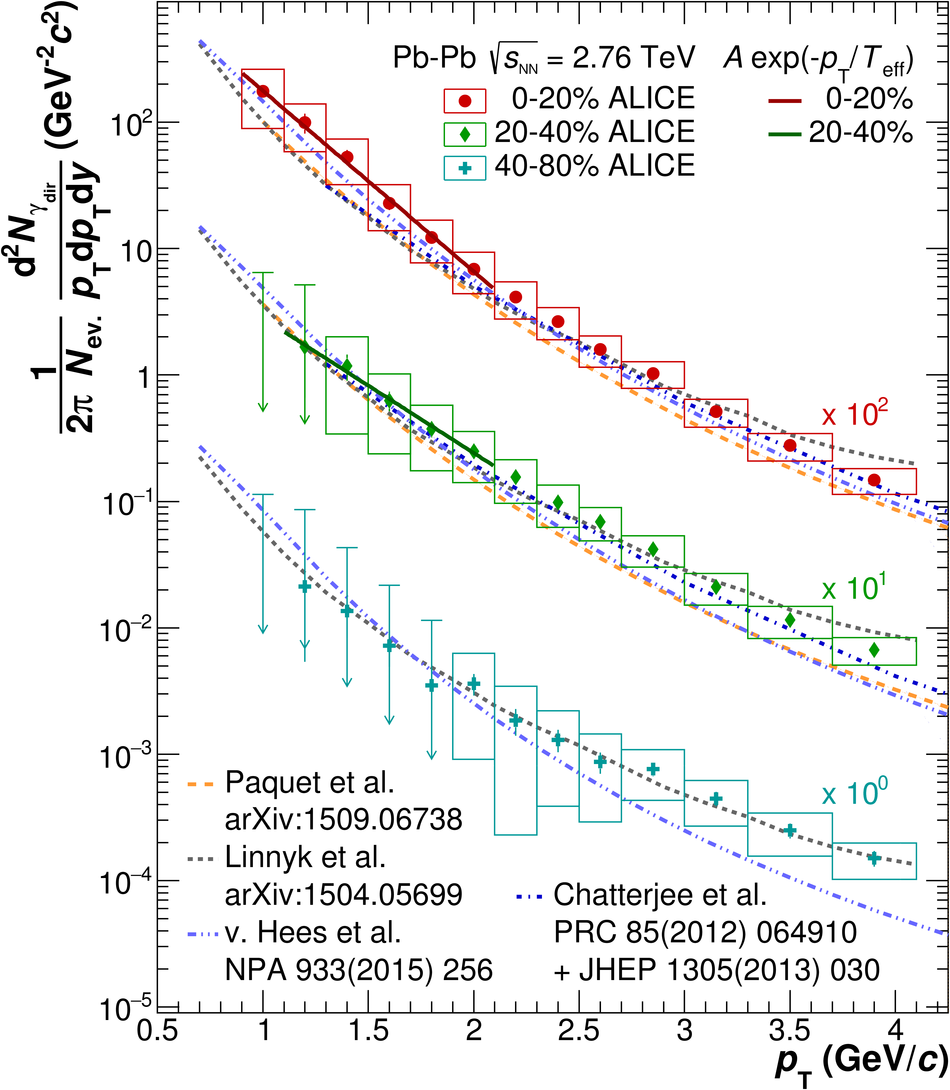
Comparison of model calculations from Refs.[59-62] with the direct photon spectra in Pb-Pb collisions at $\snn$=2.76 TeV for the 0-20% (scaled by a factor 100), the 20-40% (scaled by a factor 10) and 40-80% centrality classes. All models include a contribution from pQCD photons. For the 0-20% and 20-40% classes the fit with an exponential function is shown in addition.