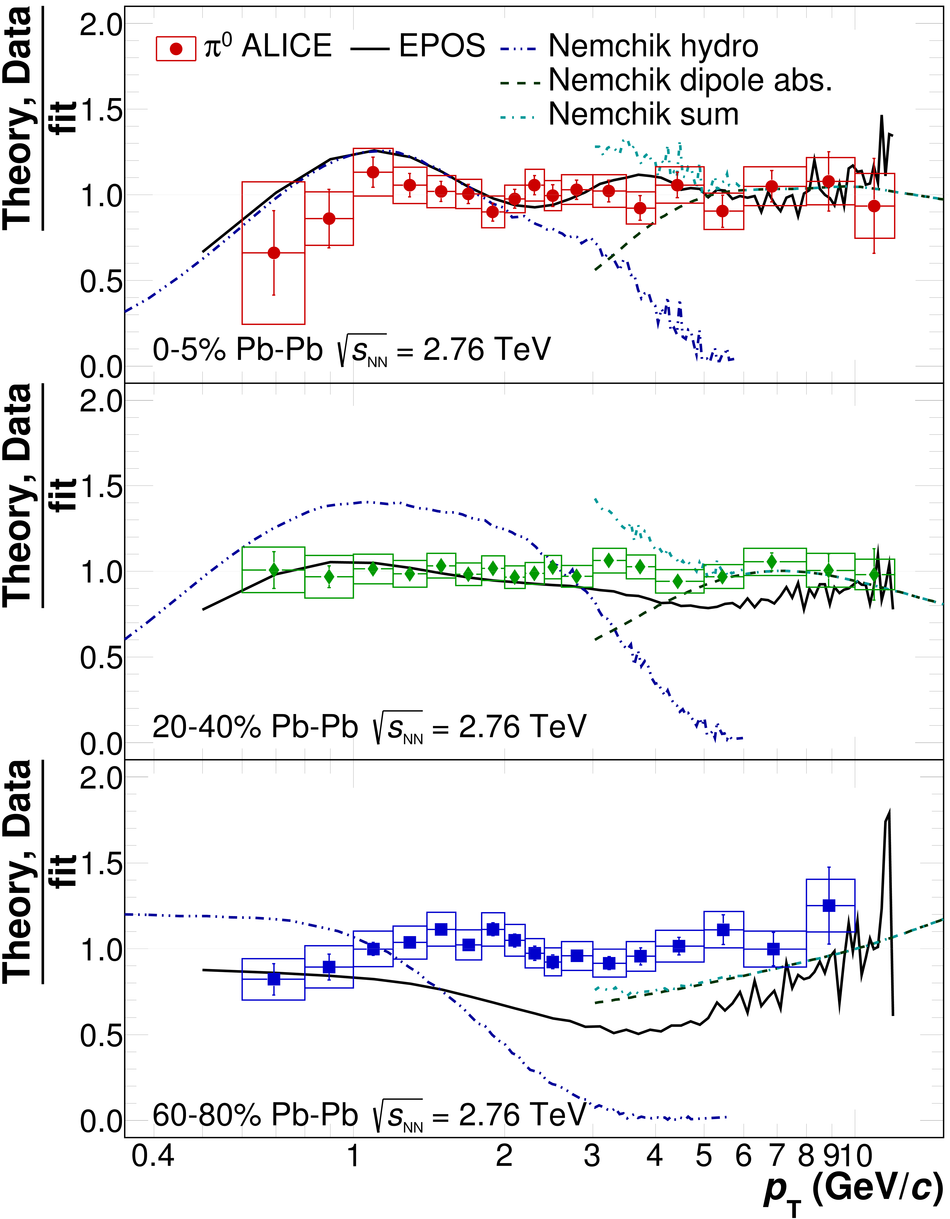
Comparison of the measured $\pi^0$ spectra for three centrality classes ($0-5\%$, $20-40\%$, $60-80\%$) with two calculations which make predictions for the full $p_{\rm T}$ range of the measurement. The calculated spectra and the data points were divided by a fit of the measured $\pi^0$ spectra. For the data points the error bars represent the statistical uncertainties and the boxes the systematic uncertainties. Calculations with the EPOS event generator are shown by the solid line. The fluctuations of the EPOS lines at high $p_{\rm T}$ are due to limited statistics in the number of generated events. The calculations by Nemchik et al. combine a hydrodynamical model at low $p_{\rm T}$ with a color dipole absorption model for $p_{\rm T} \gtrsim 3 {GeV}/c$. The two components and the sum (for $p_{\rm T} \gtrsim 3 {GeV}/c$) are shown separately.
|  |