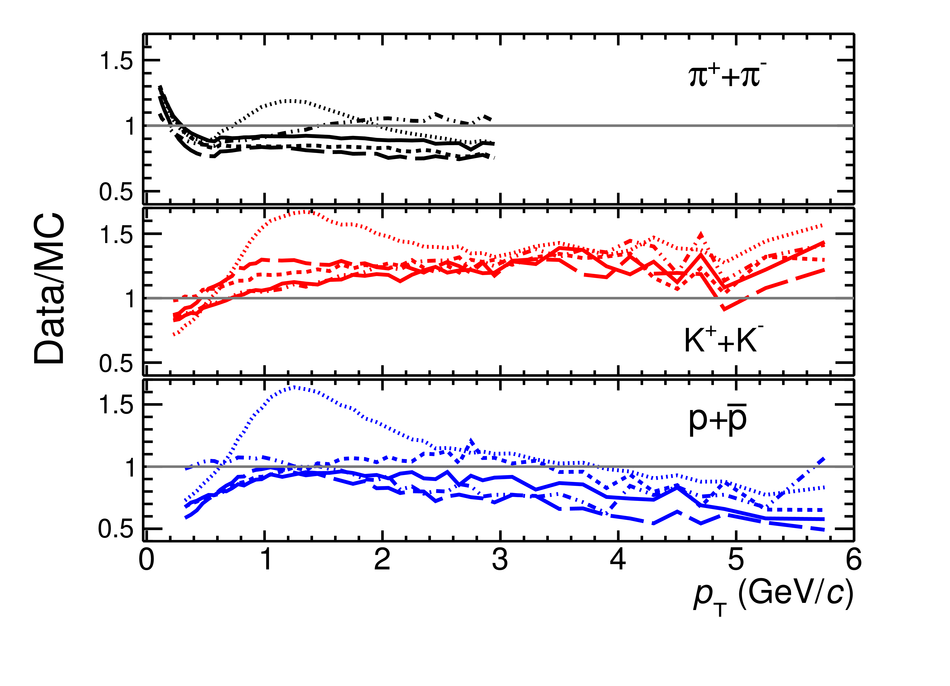
Top panel: Measured $p_{\rm{T}}$ spectra of pions, kaons and protons, sum of particles and antiparticles, compared to PYTHIA6-Z2, PYTHIA6-CentralPerugia2011, PYTHIA8, EPOS LHC and PHOJET Monte-Carlo calculations. Statistical (vertical error bars) and systematic (open boxes) uncertainties are reported for the measured spectra. Bottom panels: ratios between data and Monte-Carlo calculations. | 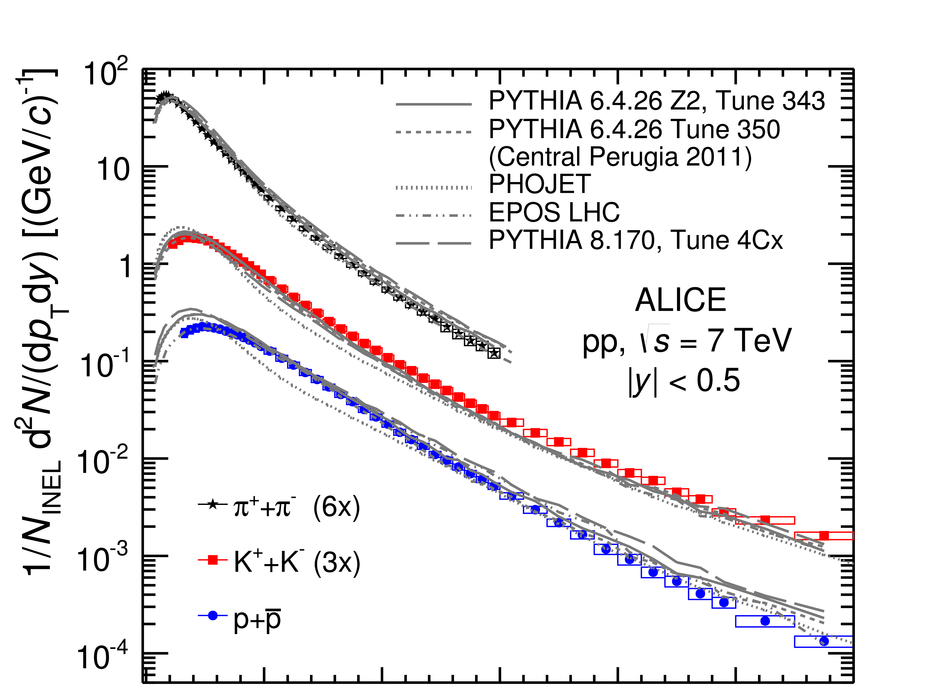 |