Production of light nuclei and anti-nuclei in pp and Pb-Pb collisions at LHC energies

The production of (anti-)deuteron and (anti-)$^{3}$He nuclei in Pb-Pb collisions at $\sqrt{s_{\rm NN}}$ = 2.76 TeV has been studied using the ALICE detector at the LHC. The spectra exhibit a significant hardening with increasing centrality. Combined blast-wave fits of several particles support the interpretation that this behavior is caused by an increase of radial flow. The integrated particle yields are discussed in the context of coalescence and thermal-statistical model expectations. The particle ratios, $^3$He/d and $^3$He/p, in Pb-Pb collisions are found to be in agreement with a common chemical freeze-out temperature of $T_{\rm chem} \approx 156$ MeV. These ratios do not vary with centrality which is in agreement with the thermal-statistical model. In a coalescence approach, it excludes models in which nucleus production is proportional to the particle multiplicity and favors those in which it is proportional to the particle density instead. In addition, the observation of 31 anti-tritons in Pb-Pb collisions is reported. For comparison, the deuteron spectrum in pp collisions at $\sqrt{s} = 7$ TeV is also presented. While the p/$\pi$ ratio is similar in pp and Pb-Pb collisions, the d/p ratio in pp collisions is found to be lower by a factor of 2.2 than in Pb-Pb collisions.


Phys. Rev. C 93 (2015) 024917
HEP Data
e-Print: arXiv:1506.08951 | PDF | inSPIRE
CERN-PH-EP-2015-025

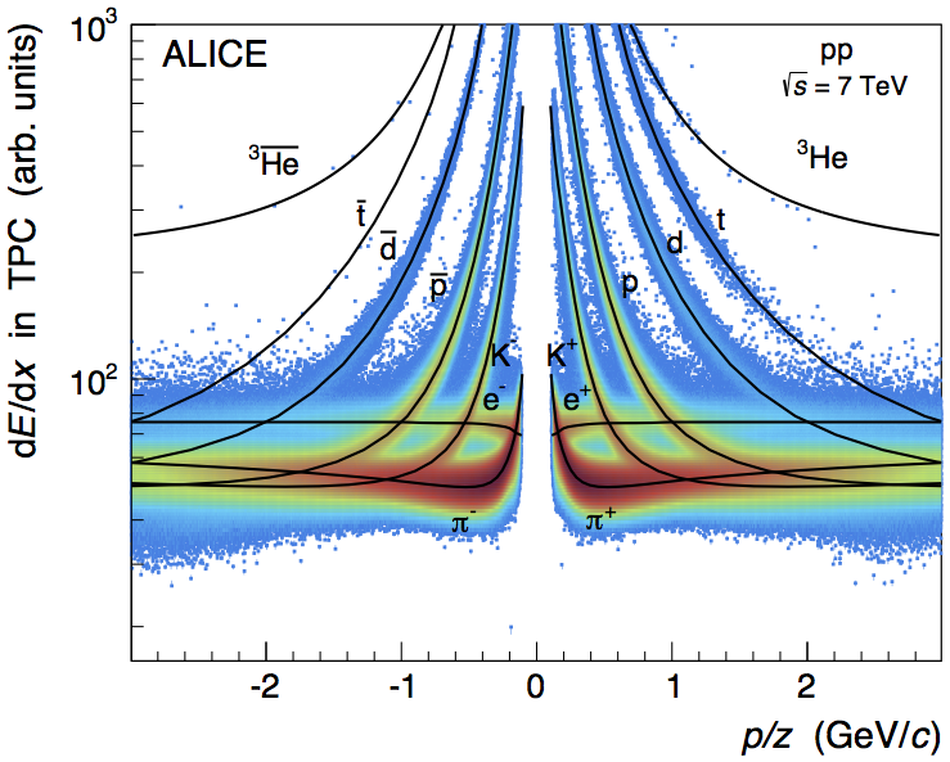
Figure 1

Specific energy loss (d$E$/d$x$) vs. rigidity (momentum/charge) for TPC tracks from pp collisions at $\sqrt{s}$ = 7 TeV (top panel) and from 0-80% most central Pb-Pb collisions at $\snn$ = 2.76 TeV (bottom panel). The solid lines represent a parametrization of the Bethe-Bloch curve.

Figure 2

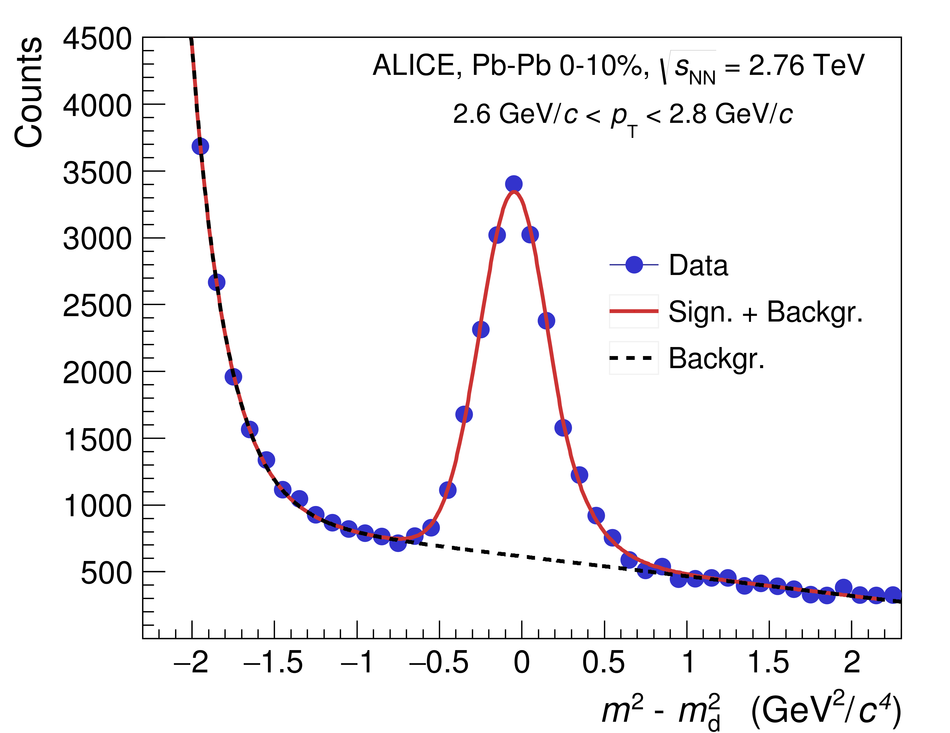
Distribution of $(m^{2} - m^{2}_{\rm d})$ measured with the TOF detector for tracks with 2.6 GeV/$c <  \pt\ < 2.8$ GeV/$c$ from central Pb-Pb collisions showing the peak corresponding to the deuteron mass $m_{\rm d}$ and the background from mismatched tracks (black dotted line) which is subtracted to obtain the raw yields (see text for details).

Figure 3

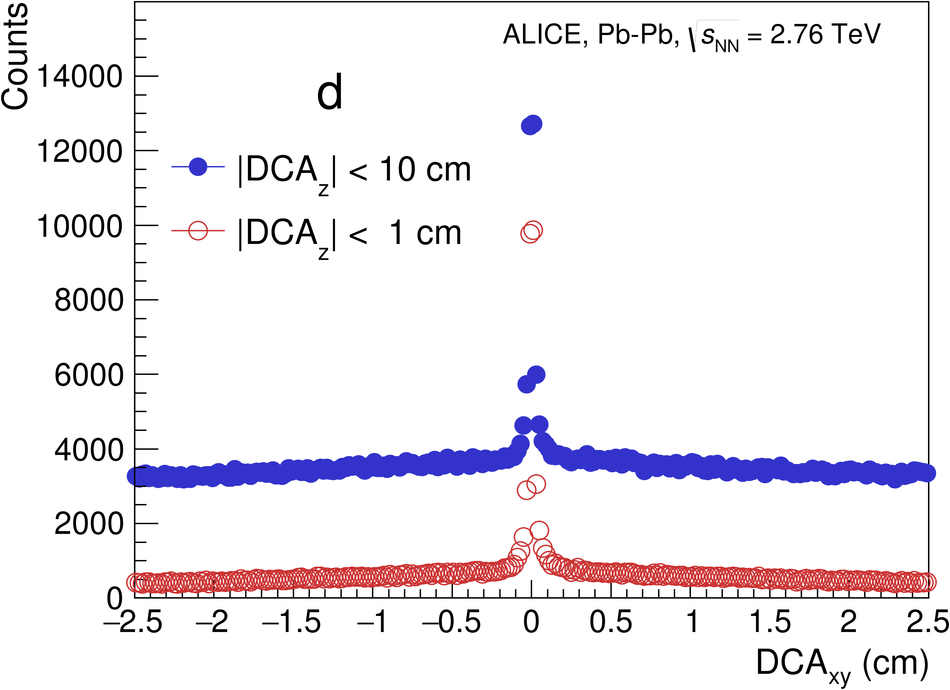
Distribution of DCA$_{xy}$ for deuterons (left) and anti-deuterons (right) in the transverse momentum range $0.7$ GeV/$c$ $< p_{\rm T} < 1.4$ GeV/$c$ for 0-80% most central Pb-Pb collisions at $\snn$ = 2.76 TeV demonstrating the influence of cuts in DCA$_{z}$ on d and $\overline{\rm d}$.

Figure 4

Distribution of DCA$_{xy}$ of identified deuterons in the transverse momentum range $0.9$ GeV/$c$ $< p_{\rm T} < 1.0$ GeV/$c$ for central Pb-Pb collisions ($\snn$ = 2.76 TeV) along with the Monte-Carlo templates which are fitted to the data (see text for details).

Figure 5

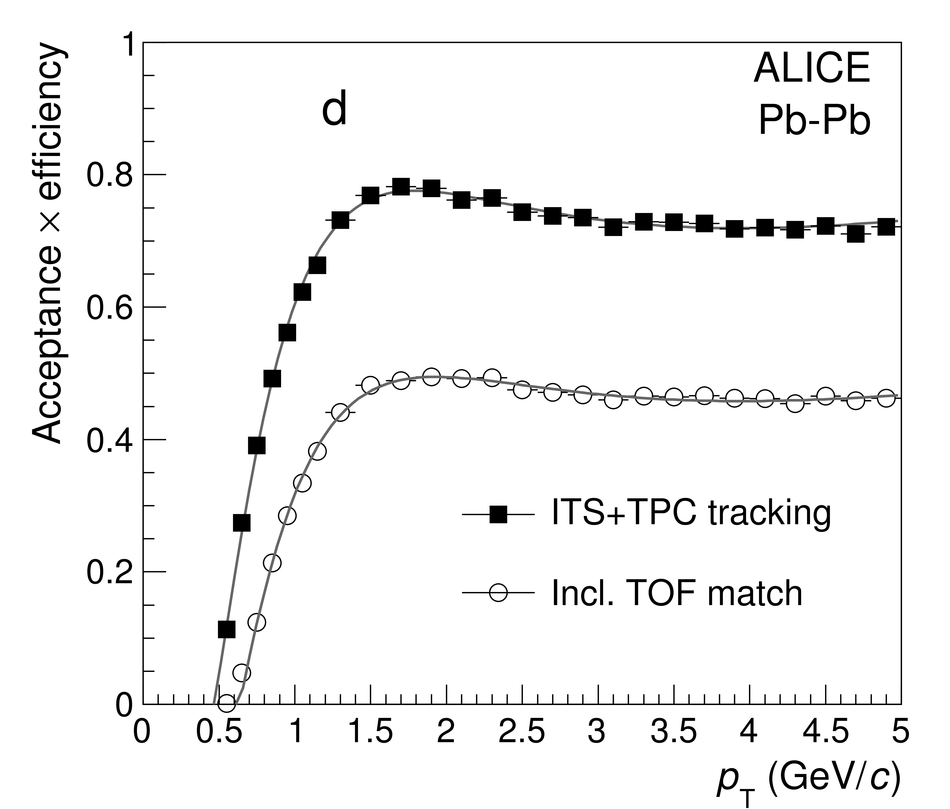
Acceptance$\times$efficiency as a function of transversemomentum ($\pt$) for deuterons (left) and for $\rm ^{3}He$ (middle) in Pb-Pb collisions at $\snn$ = 2.76 TeV, as well as for deuterons in pp collisions at $\sqrt{s}$ = 7 TeV (right panel). The curves represent afit with the function presented in Eq. 2 (see text for details).

Figure 6

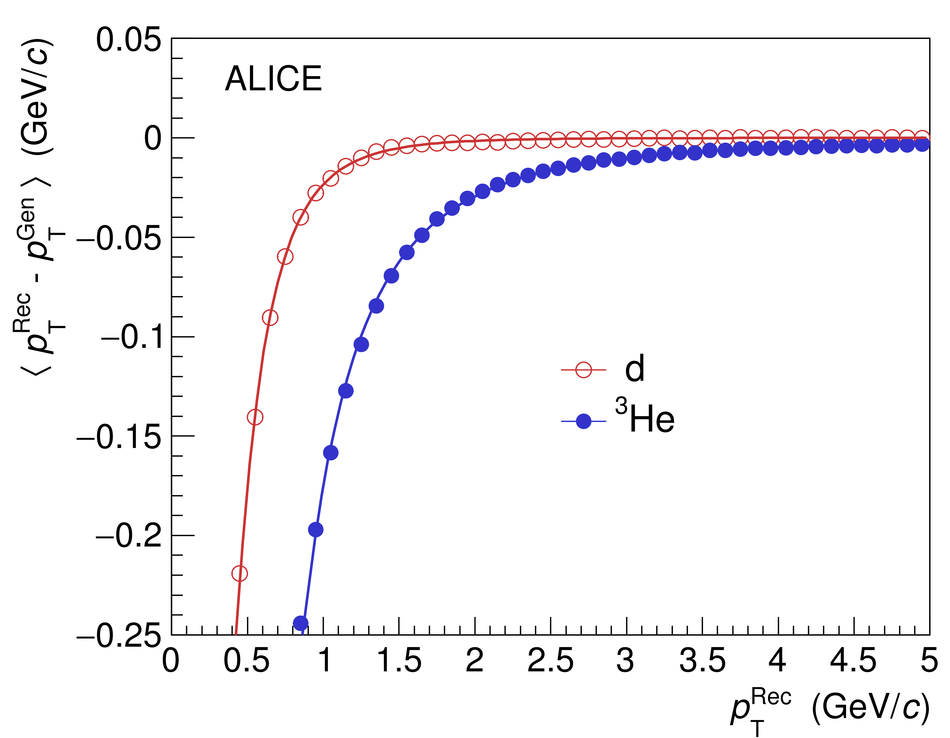
The average difference between the reconstructed and the generated $\pt$ is plotted as a function of the reconstructed $\pt$ for simulated deuterons and $\rm ^3He$ for Pb-Pb collisions at $\snn$ = 2.76 TeV. The lines represent a fit with the functional form as shown in Eq.(3) (see text for details).

Figure 7

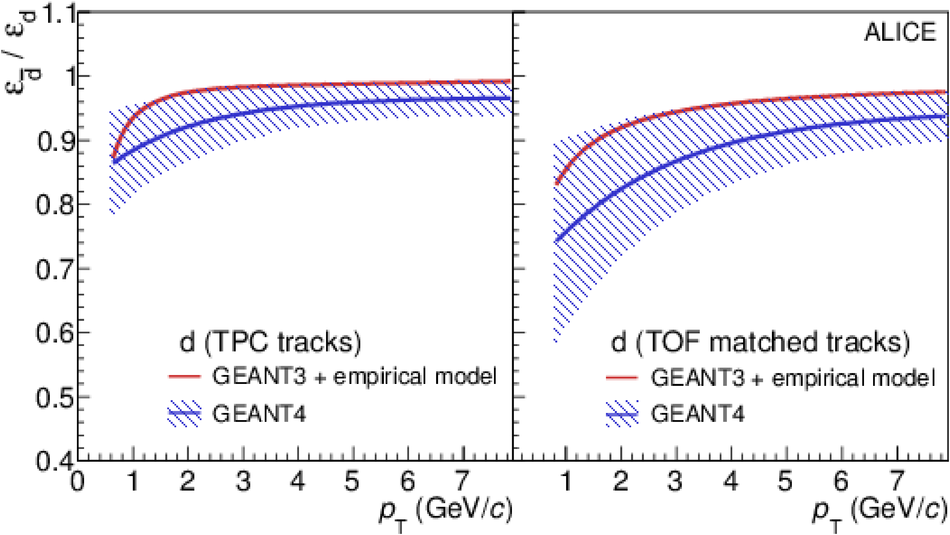
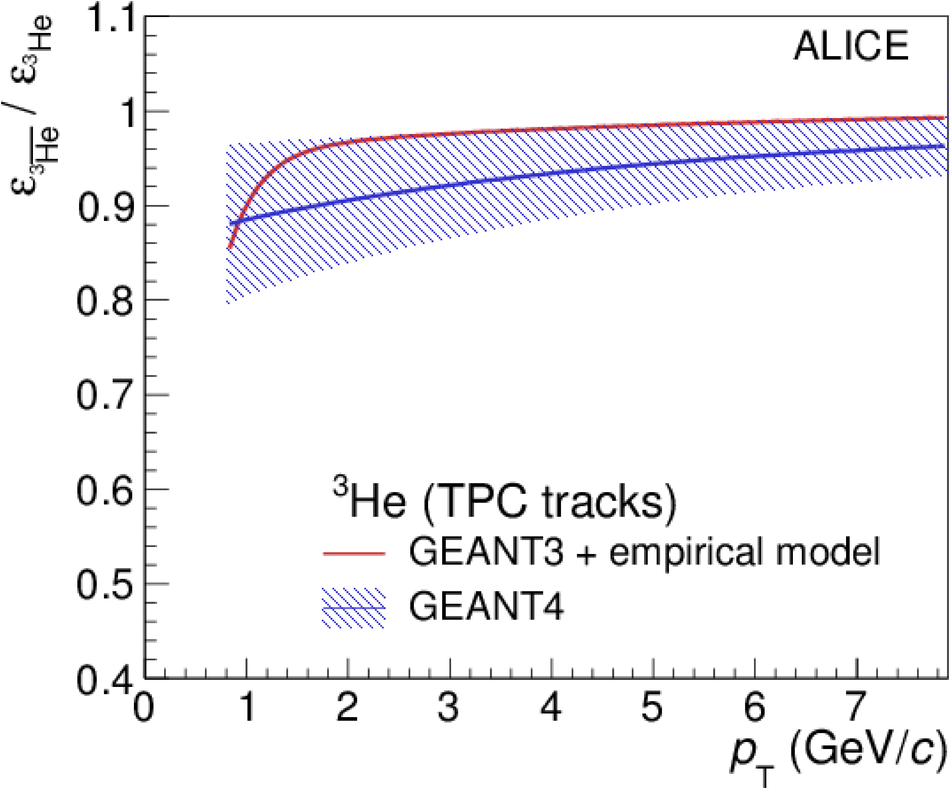
Ratio of anti-particle to particle efficiency based on GEANT4 and a modified version of GEANT3 including an empirical model to describe the hadronic interaction of anti-nuclei for (anti-)deuterons (left) and for (anti-)$\rm ^3He$ (right). The estimate of the systematic uncertainty for the hadronic interaction based on the difference between the two models is indicated by the blue band.

Figure 8

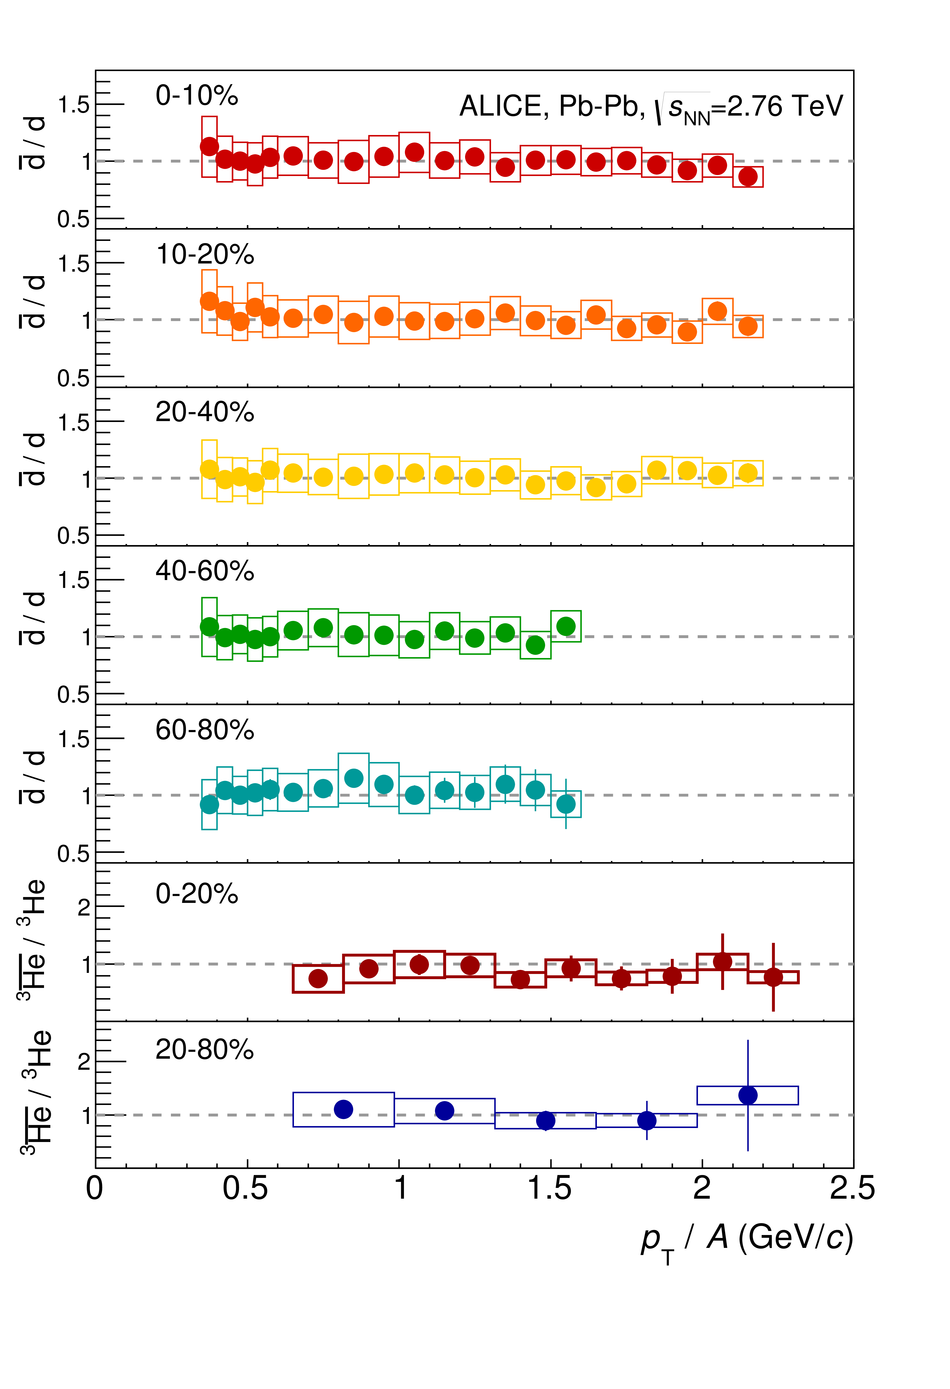
Ratios of $\overline{\rm d}$ and ${\rm d}$ as well as of $^{3}\overline{\rm He}$ and $\rm ^3He$ versus $\pt$ per nucleon for various centrality classes in Pb-Pb collisions at $\snn$ = 2.76 TeV. Boxes describe the systematic uncertainties, vertical lines the statistical ones.

Figure 9

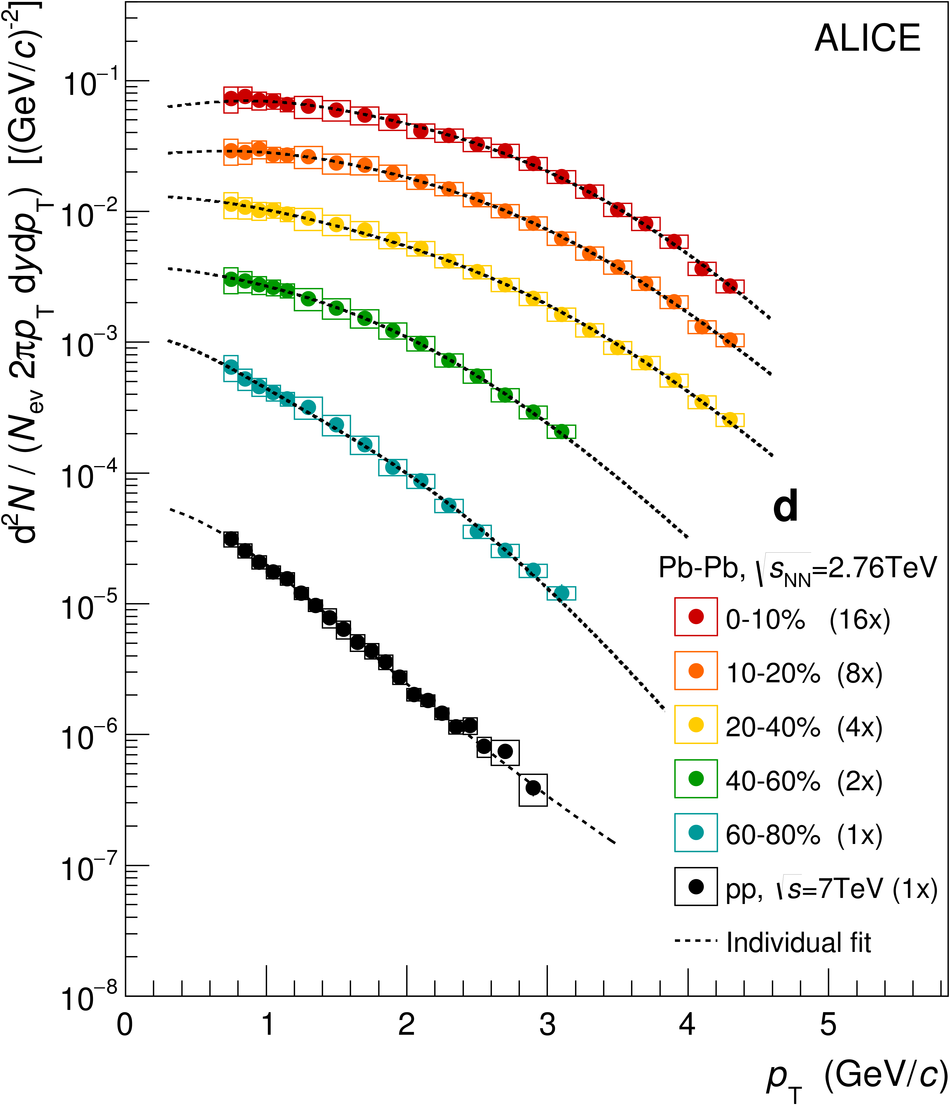
Efficiency and acceptance corrected deuteron spectra for Pb-Pb collisions at $\sqrt{s_{\rm NN}}$ = 2.76 TeV in various centrality classes and for inelastic pp collisions at $\sqrt{s}$ =7 TeV. The dashed lines represent an individual fit with the BW function (Eq. 6) in the case of Pb-Pb spectra and with the function presented in (Eq. 5) in the case of the pp spectrum (see text for details). The boxes show systematic error and vertical lines show statistical error separately.

Figure 10

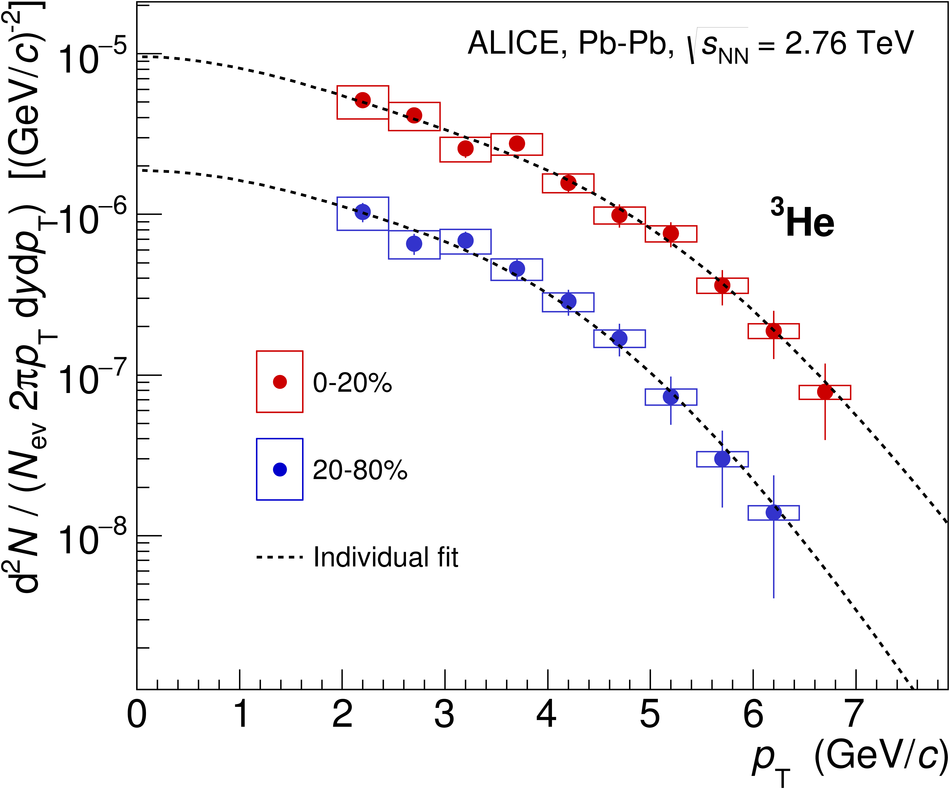
$^{3}$He spectra for two centrality classes (0-20% and 20-80%) are shown for Pb-Pb collisions at $\sqrt{s_{\rm NN}}$ = 2.76 TeV. The spectra are fitted individually with the BW function (dashed lines). The systematic and statistical errors are shown by boxes and vertical lines, respectively.

Figure 11

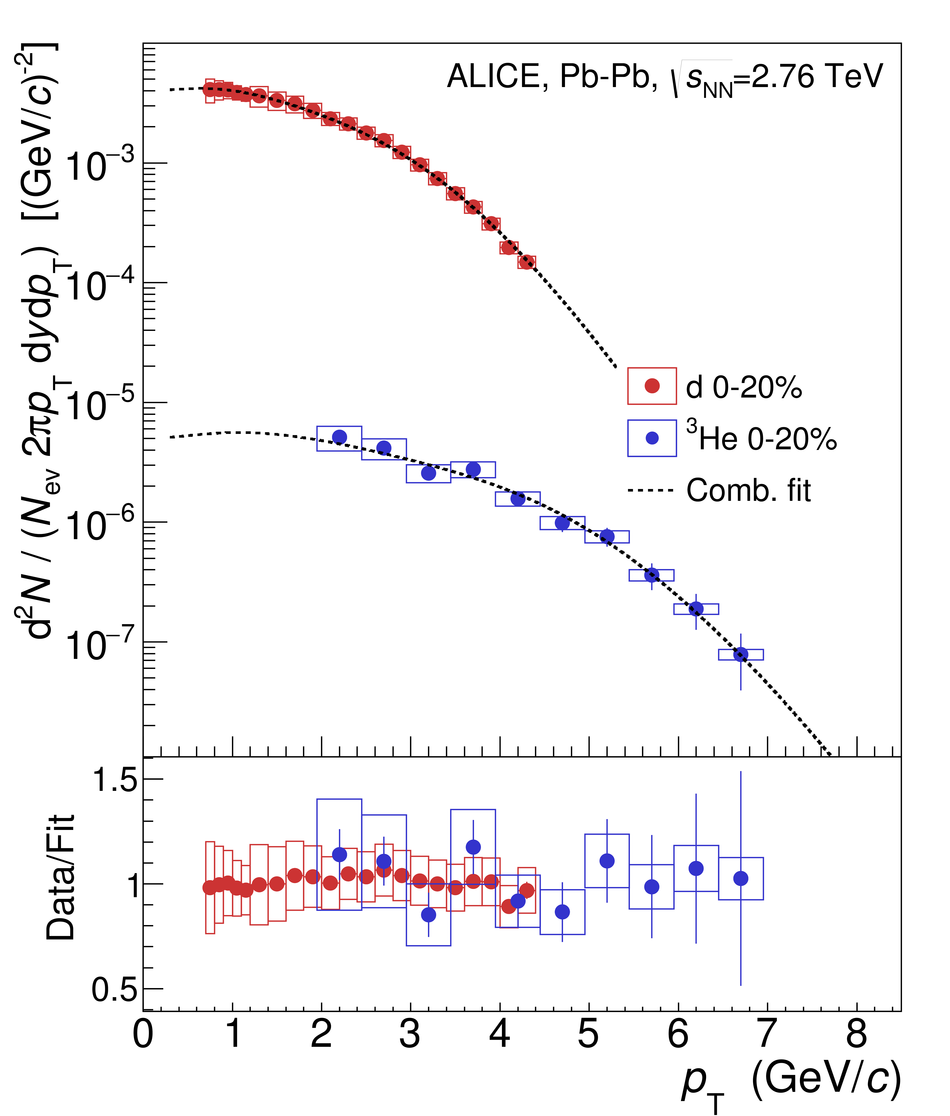
The top panel shows the combined fit of deuteron and $\rm ^3He$ spectra with the BW function for 0-20% centrality for Pb-Pb collisions at $\snn$ = 2.76 TeV. The systematic and statistical errors are shown by boxes and vertical line, respectively. The lower panel shows the deviation of the spectra from the BW fits.

Figure 12

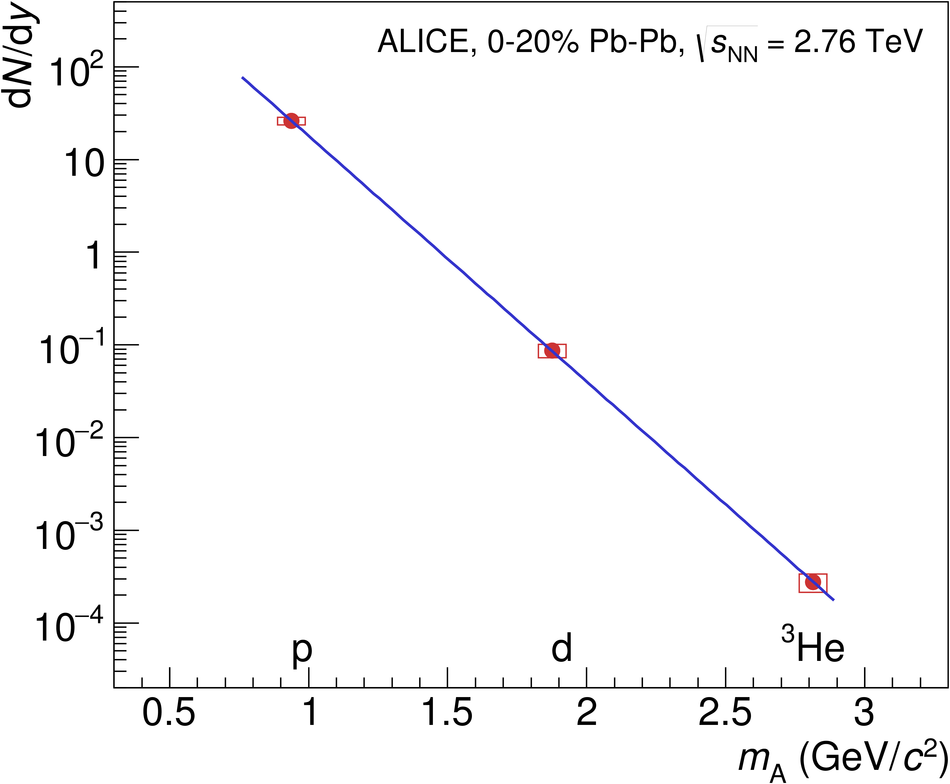
The production yield d$N$/d$y$ of light nuclei as a function of the particle mass $m_{{\rm A}}$ measured for 0-20% centrality class in Pb-Pb collisions at $\snn$ = 2.76 TeV. The line represents a fit with an exponential function.

Figure 13

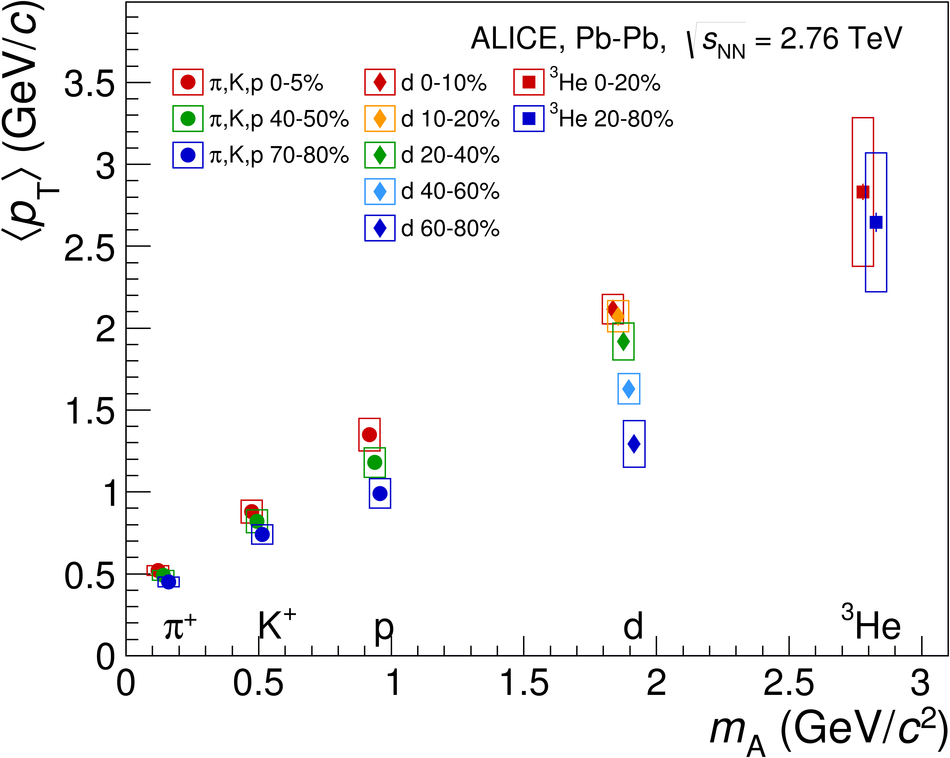
Mean transverse momentum $\langle p_{\rm T} \rangle$ as a function of particle mass for various centrality classes are shown for Pb-Pb collisions at $\snn$ = 2.76 TeV.

Figure 14

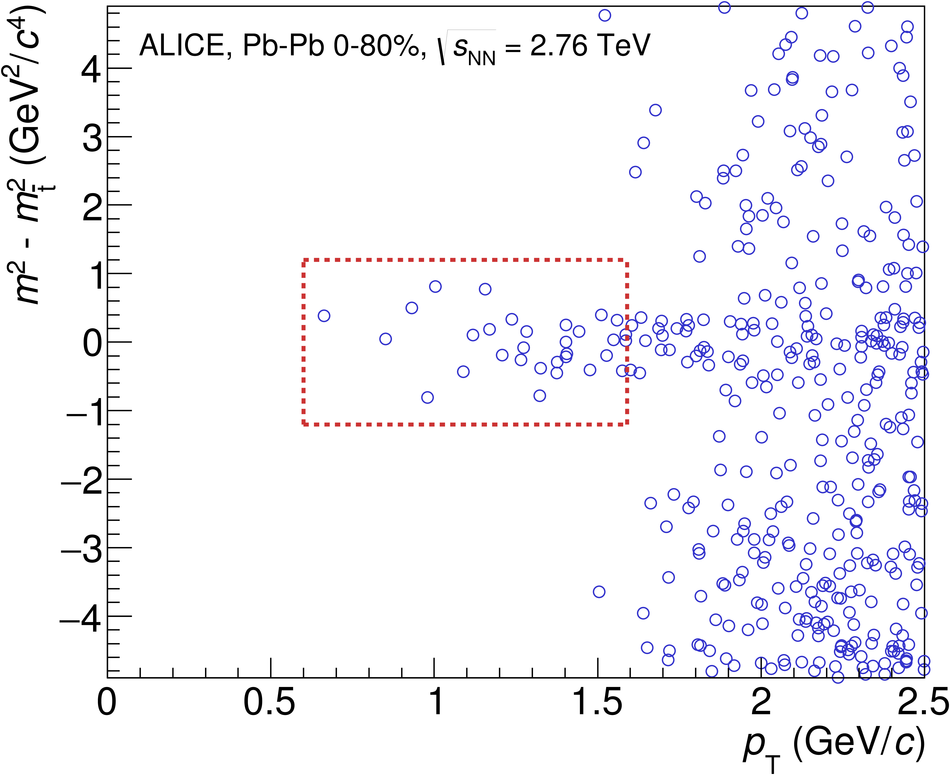
Scatter plot of $(m^{2} - m^{2}_{\rm \bar{t}})$ measured with the TOF detector versus $p_{\mathrm{T}}$. Only those tracks are shown which pass the pre-selection done by applying a 3$\sigma$ cut on the TPC d$E$/d$x$. The $p_{\mathrm{T}}$-region in which the candidates are identified on a track-by-track basis is shown as red box.

Figure 15

Blast-wave fit of $\pi^+$, K$^+$, p, d, and $\rm ^{3}He$ particles for 0-20% centrality for Pb-Pb collisions at $\sqrt{s_{\rm NN}}$ = 2.76 TeV. Solid symbols denote the $p_{\rm T}$ range of the spectra used forthe fits, while the open symbols show the remaining part. The lower panels show the deviations of the measured spectra to the BW fits.

Figure 16

d/p and $^{3}$He/p ratio in heavy-ion collisions as a function of event multiplicity. Within the uncertainties no significant variation with multiplicity is observed The d/p and $\overline{\rm d}$/$\overline{\rm p}$ results from the PHENIX Collaboration are averaged as explained in the text. The lines represent fits with a constant to the ALICE data points.

Figure 17

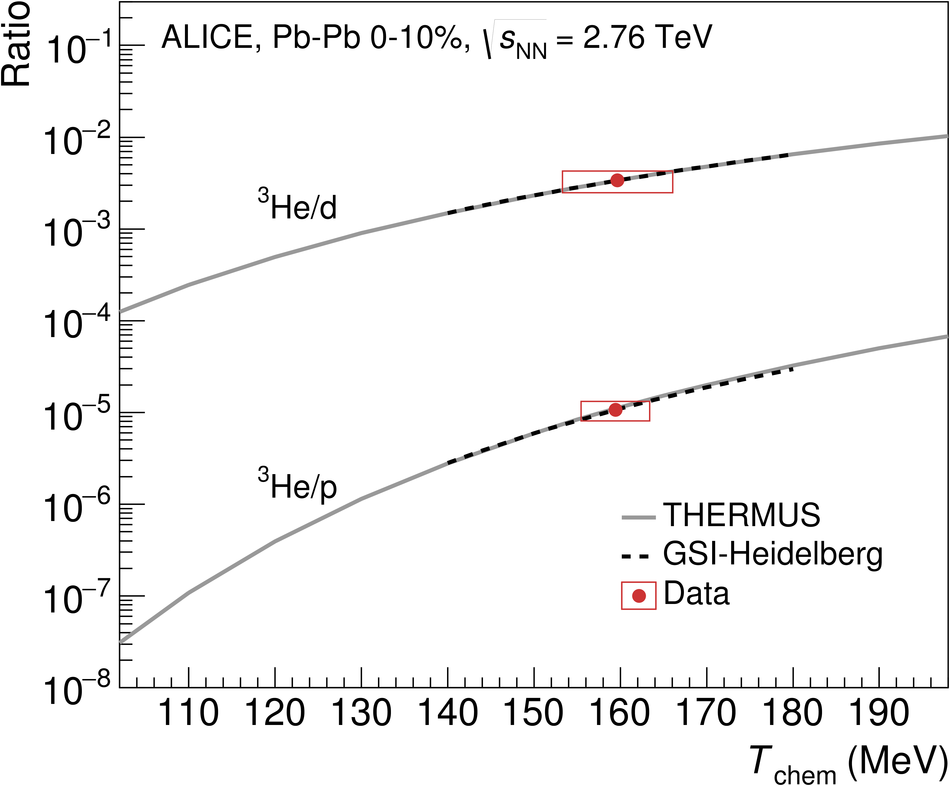
Particle ratios of nuclei as measured in 0-10% most central Pb-Pb collisions compared to the THERMUS [54] model(solid lines) and the GSI-Heidelberg model [1] (dashed lines) as a function of the chemical freeze-out temperature $T_{\rm chem}$. The $\rm ^3He$ yield is scaled to 0-10%. Horizontal error bars indicate the temperature range obtained by a projection of the total error of the ratio on the temperature axis.

Figure 18

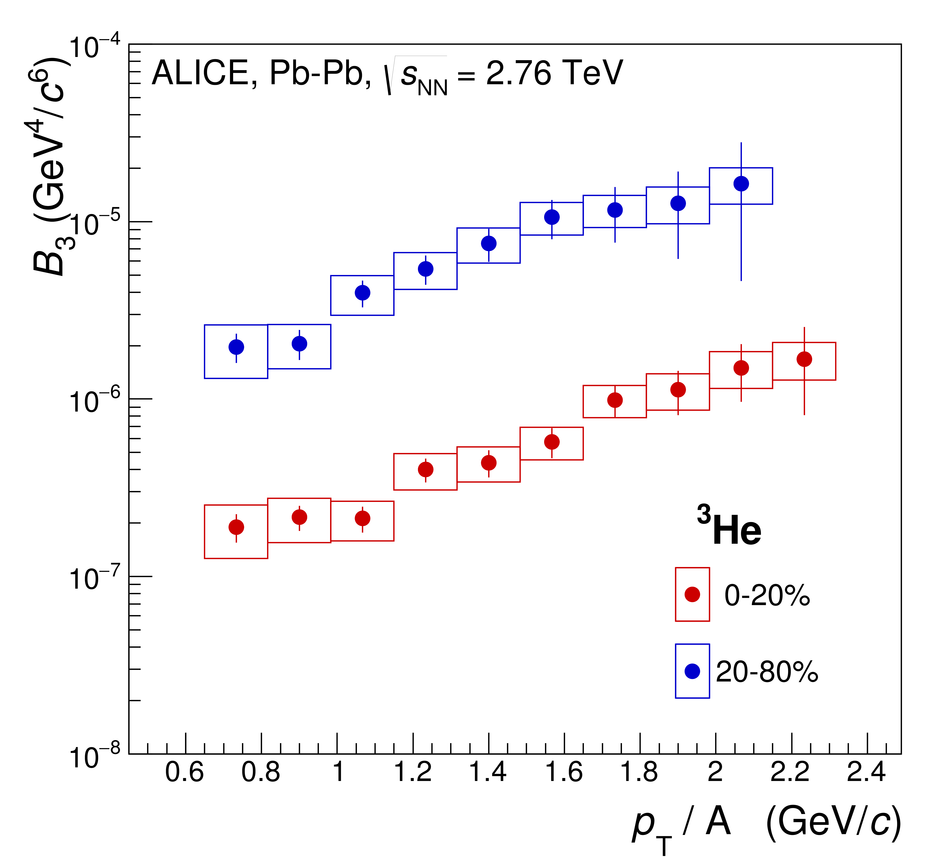
The coalescence parameters $B_2$ (left) and $B_3$ (right) as a function of the transverse momentum per nucleon for various centrality classes in Pb-Pb collisions at $\snn$ = 2.76 TeV.