Proton DCA$_{xy}$ distribution in the range 0.55 < $p_{\rm{T}}$< 0.60GeV/$c$ together with the Monte-Carlo templates for primary protons (green dotted line), secondary protons from weak decays (red dotted line) and secondary protons produced in interactions with the detector material (blue dashed line) which are fitted to the data. The light blue line represents the combined fit, while the black dots are the data. | 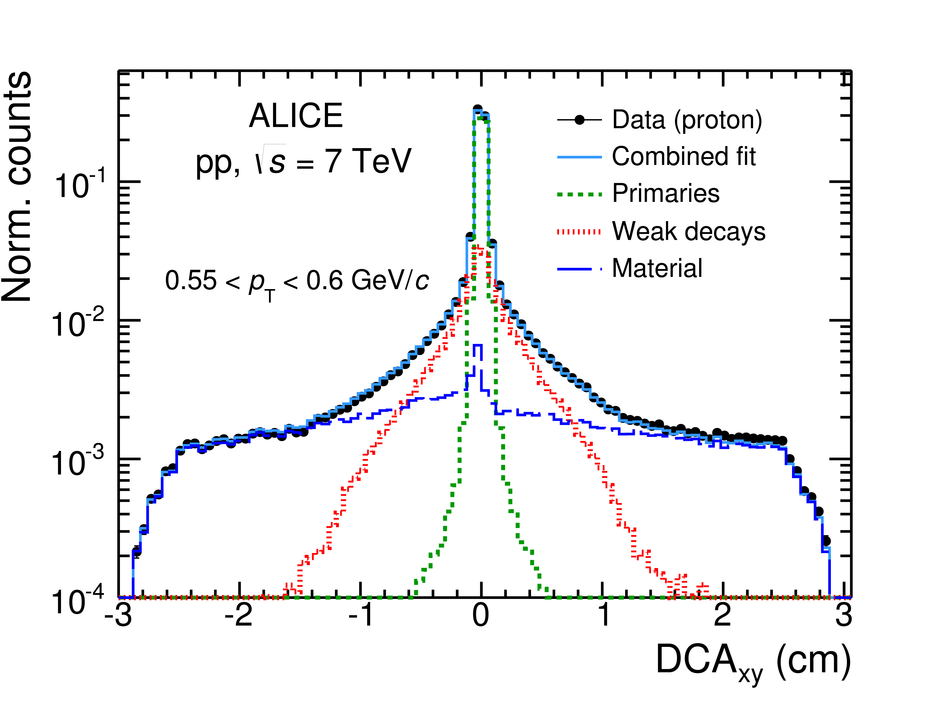 |