Distributions of $\langle\theta_{\rm{ckov}}\rangle$ measured with the HMPID in the two narrow $p_{\rm{T}}$ intervals 3.4 < $p_{\rm{T}}$ $< $ 3.6 GeV/$c$ (top) and 5 < $p_{\rm{T}}$ < 5.5 GeV/$c$ (bottom) for tracks from negatively-charged particles. Solid lines represent the total fit (sum of three Gaussian functions). Dotted lines correspond to pion, kaon and proton signals. The background is negligible. | 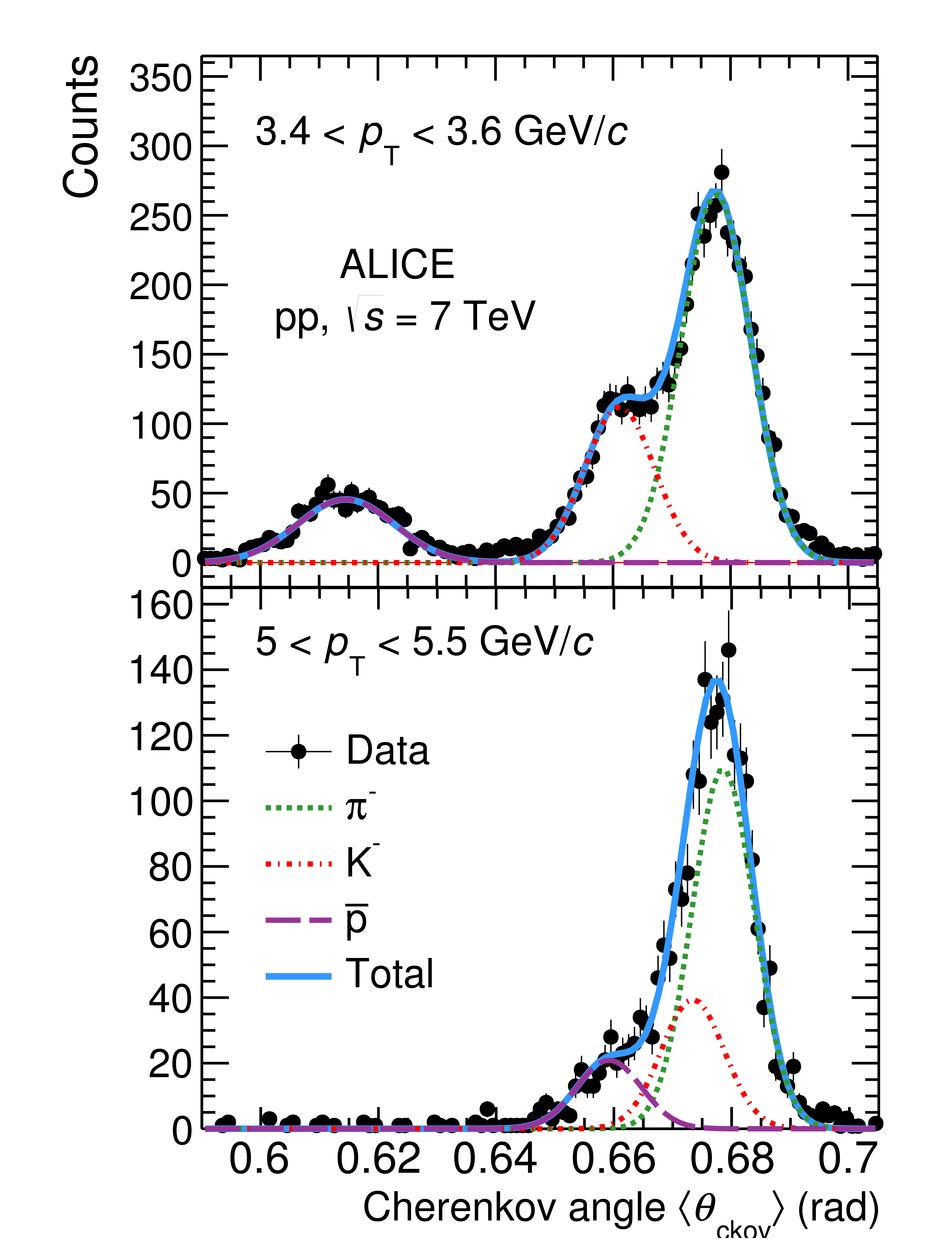 |