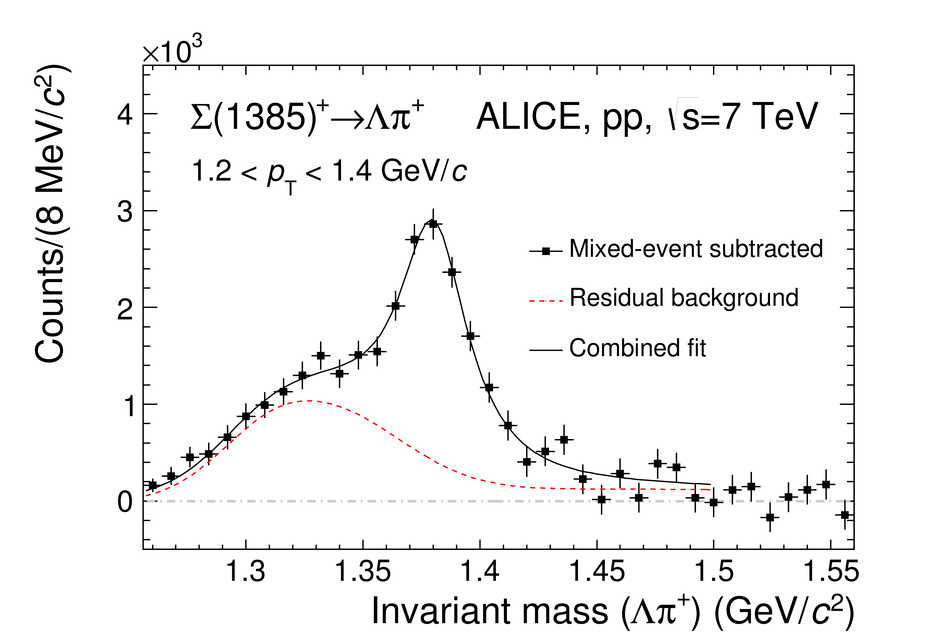
(Top panel) The $\mathrm {\Lambda}$$\mathrm {\pi^+}$invariant mass distribution in $\left | y \right | $$< $0.5 for the transverse momentum bin 1.2$< $$p_{\rm T}$$< $1.4 GeV$\kern-0.15em /\kern-0.12em c$ in pp collisions at $\sqrt{s}$=7TeV The background shape estimated using pairs from different events (event-mixing) is shown as open red squares. The mixed-event background is normalized in the range 1.56$< M< $2.0 GeV$\kern-0.15em /\kern-0.12em c^2$, where $M$ is the $\mathrm {\Lambda}$$\mathrm {\pi^+}$invariant mass (Bottom panel) The invariant mass distribution after mixed-event background subtraction for 1.2$< $$p_{\rm T}$$< $1.4 GeV$\kern-0.15em /\kern-0.12em c$ The solid curve is the result of the combined fit (see text for details) and the dashed lines describes the residual background |  |