The pseudorapidity ($\eta$) and transverse-momentum ($p_{\rm T}$) distributions of charged particles produced in proton-proton collisions are measured at the centre-of-mass energy $\sqrt{s}$ = 13 TeV. The pseudorapidity distribution in $|\eta|<~$ 1.8 is reported for inelastic events and for events with at least one charged particle in $|\eta|<~$ 1. The pseudorapidity density of charged particles produced in the pseudorapidity region $|\eta|<~$ 0.5 is 5.31 $\pm$ 0.18 and 6.46 $\pm$ 0.19 for the two event classes, respectively. The transverse-momentum distribution of charged particles is measured in the range 0.15 $<~$ $p_{\rm T}$ $<~$ 20 GeV/c and $|\eta|<~$ 0.8 for events with at least one charged particle in $|\eta|<~$ 1. The correlation between transverse momentum and particle multiplicity is also investigated by studying the evolution of the spectra with event multiplicity. The results are compared with calculations from PYTHIA and EPOS Monte Carlo generators.
Phys. Lett. B 753 (2016) 319-329
HEP Data
e-Print: arXiv:1509.08734 | PDF | inSPIRE
CERN-PH-EP-2015-270
Figure 1
Average pseudorapidity density of charged particles as a function of $\eta$ produced in pp collisions at $\sqrt{s}$ = 13 TeV. The ALICE results are shown in the normalisation classes INEL and INEL>0 and compared to Monte Carlo calculations [18,19,24,26-28] and to the results from the CMS Collaboration. The uncertainties are the quadratic sum of statistical and systematic contributions. |  |
Figure 2
Charged-particle pseudorapidity density measured in the central pseudorapidity region $|\eta| < 0.5$ for INEL and INEL>0 events. The uncertainties are the quadratic sum of statistical and systematic contributions. The lines are power-law fits of the energy dependence of the data and the grey bands represent the standard deviation of the fits. | 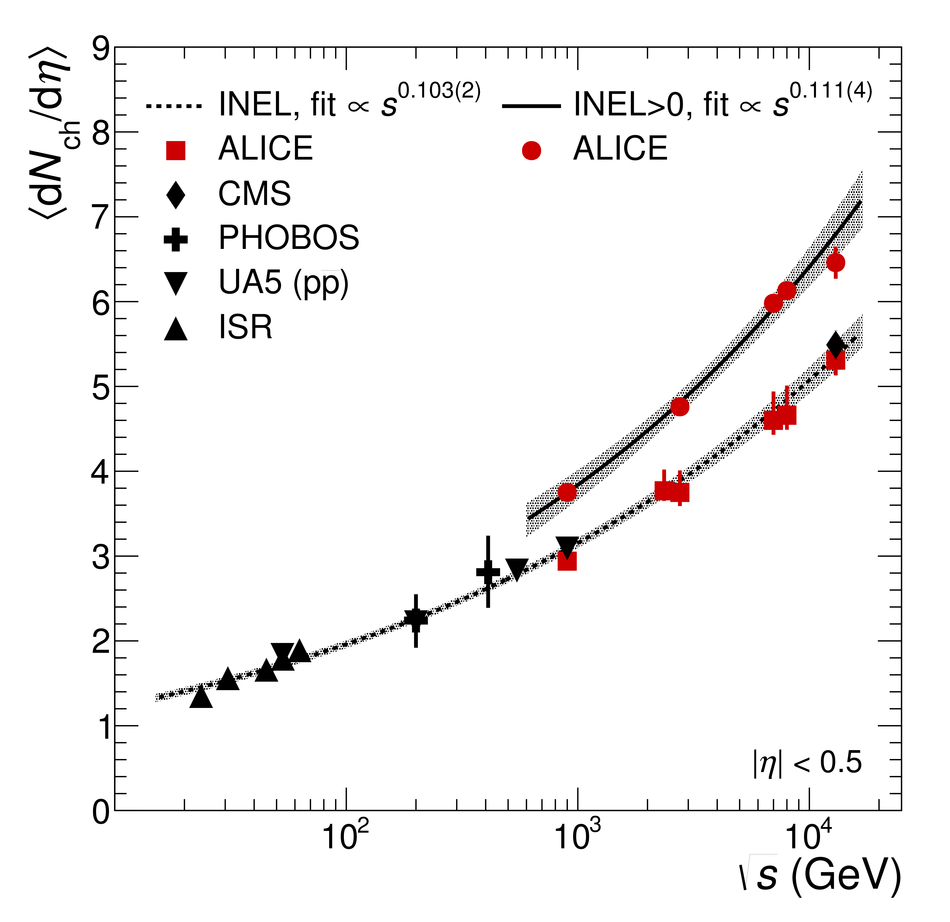 |