Measuring K$^0_{\rm S}$K$^{\rm \pm}$ interactions using Pb-Pb collisions at ${\sqrt{s_{\rm NN}}=2.76}$ TeV

We present the first ever measurements of femtoscopic correlations between the K$^0_{\rm S}$ and K$^{\rm \pm}$ particles. The analysis was performed on the data from Pb-Pb collisions at $\sqrt{s_{\rm NN}}=2.76$ TeV measured by the ALICE experiment. The observed femtoscopic correlations are consistent with final-state interactions proceeding via the $a_0(980)$ resonance. The extracted kaon source radius and correlation strength parameters for K$^0_{\rm S}$K$^{\rm -}$ are found to be equal within the experimental uncertainties to those for K$^0_{\rm S}$K$^{\rm +}$. Comparing the results of the present study with those from published identical-kaon femtoscopic studies by ALICE, mass and coupling parameters for the $a_0$ resonance are constrained. Our results are also compatible with the interpretation of the $a_0$ having a tetraquark structure over that of a diquark.


Phys. Lett. B 774 (2017) 64
HEP Data
e-Print: arXiv:1705.04929 | PDF | inSPIRE
CERN-EP-2017-063

Figure 1

Examples of raw K$^0_{\rm S}$K$^{\rm +}$ correlation functions for the three $k_T$ bins with linear fits to the baseline at large $k^*$. Statistical uncertainties are shown.

Figure 2

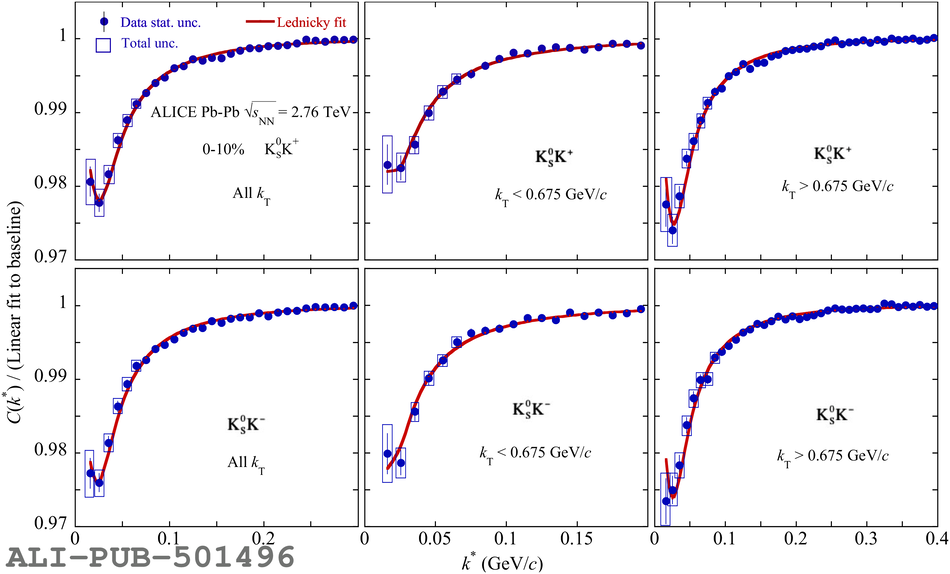
Examples of K$^0_{\rm S}$K$^+$ and K$^0_{\rm S}$K$^-$ correlation functions divided by linear fits to the baseline with the Lednicky parameterization using the Achasov2 parameters. Statistical (lines) and the linear sum of statistical and systematic uncertainties (boxes) are shown.

Figure 3

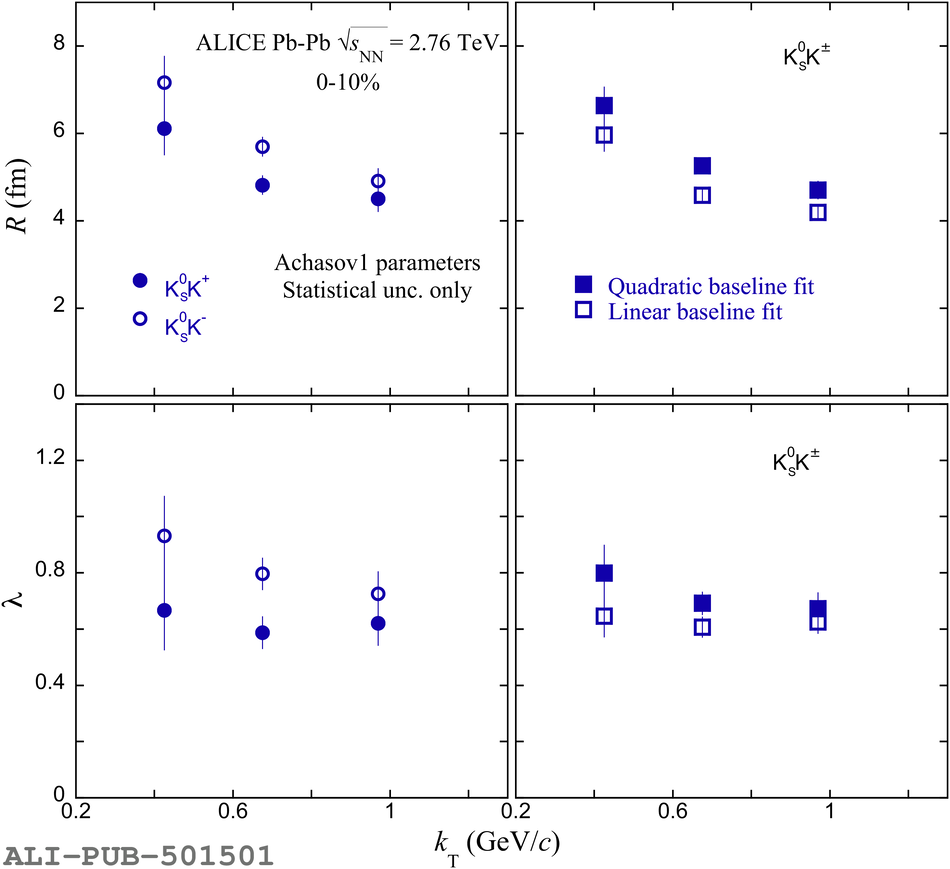
Sample results for the $R$ and $\lambda$ parameters extracted in the present analysis from K$^0_{\rm S}$K$^{\rm \pm}$ femtoscopy using the Achasov1 parameters. The left column compares K$^0_{\rm S}$K$^{\rm +}$and K$^0_{\rm S}$K$^{\rm -}$ results from the quadratic baseline fit method, and the right columncompares results averaged over K$^0_{\rm S}$K$^{\rm +}$and K$^0_{\rm S}$K$^{\rm -}$ for the quadratic baseline fits and the linear baseline fits Statistical uncertainties are plotted for all results.

Figure 4

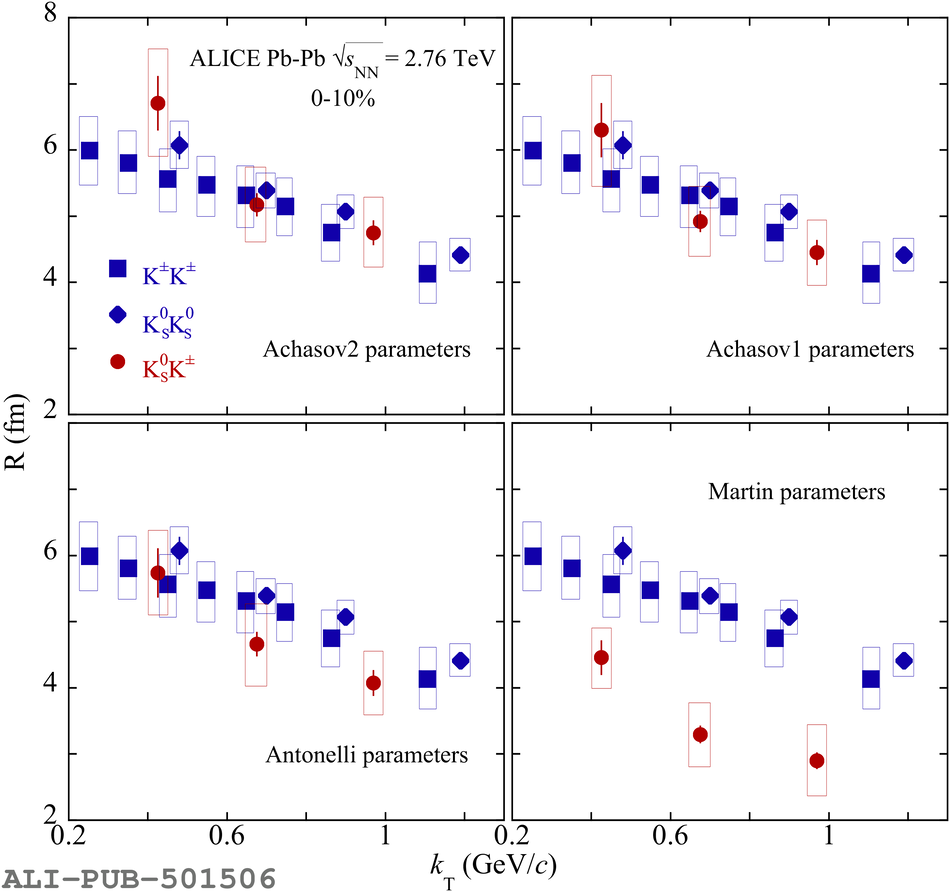
Source radius parameter, $R$, extracted in the present analysis from K$^0_{\rm S}$K$^{\rm \pm}$ femtoscopy averaged over K$^0_{\rm S}$K$^{\rm +}$and K$^0_{\rm S}$K$^{\rm -}$ and the two baseline fit methods (red symbols),along withcomparisons with identical kaon results from ALICE  (blue symbols) Statistical (lines) and the linear sum of statistical and systematic uncertainties (boxes) are shown.

Figure 5

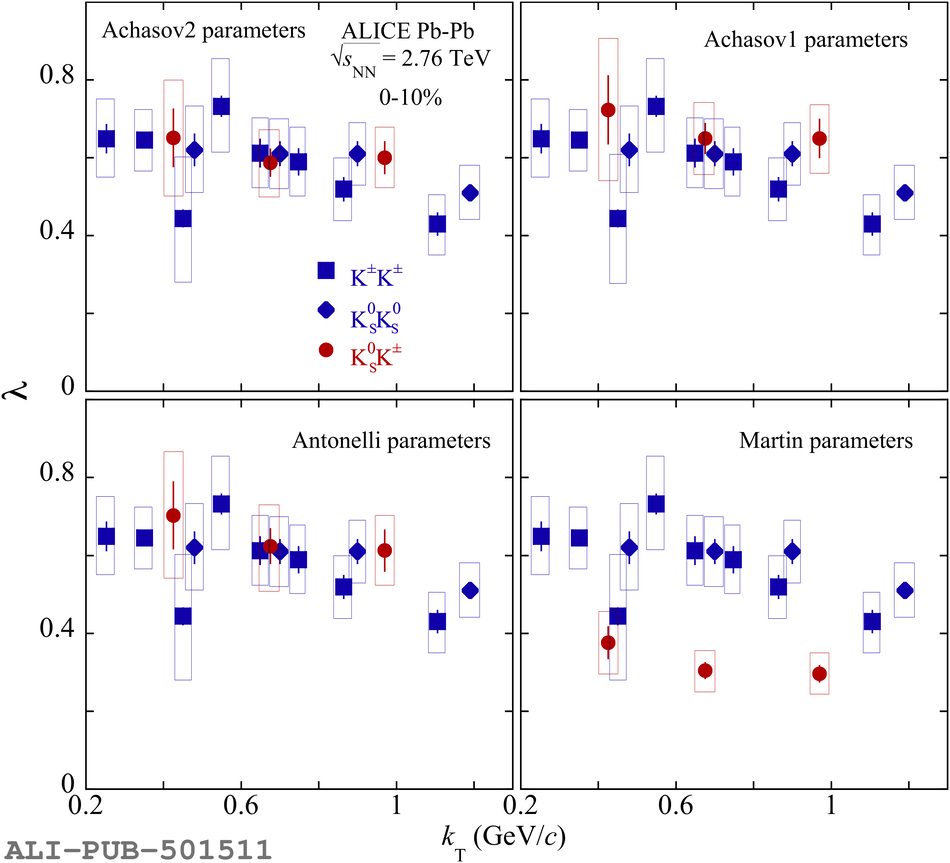
Correlation strength parameter, $\lambda$, extracted in the present analysis from K$^0_{\rm S}$K$^{\rm \pm}$ femtoscopy averaged over K$^0_{\rm S}$K$^{\rm +}$and K$^0_{\rm S}$K$^{\rm -}$ and the two baseline fit methods (red symbols), along withcomparisons with identical kaon results from ALICE  (blue symbols) Statistical (lines) and the linear sum of statistical and systematic uncertainties (boxes) are shown.