Correlation strength $b_{corr}$ as a function of $\delta\eta$ for $\eta_{gap}=0$ in pp collisionsfor $\sqrt{s}=0.9$, 2.76 and 7 TeV The MC results from PYTHIA6 Perugia 0 (solid line), Perugia 2011 (dotted line) and PHOJET (dashed line), calculated at generator level, are shown for comparison. The bottom panels show the ratio of $b_{corr}$ between data and MC. The red dashed curves correspond to the model of independent particle emission from a fluctuating source (see text) | 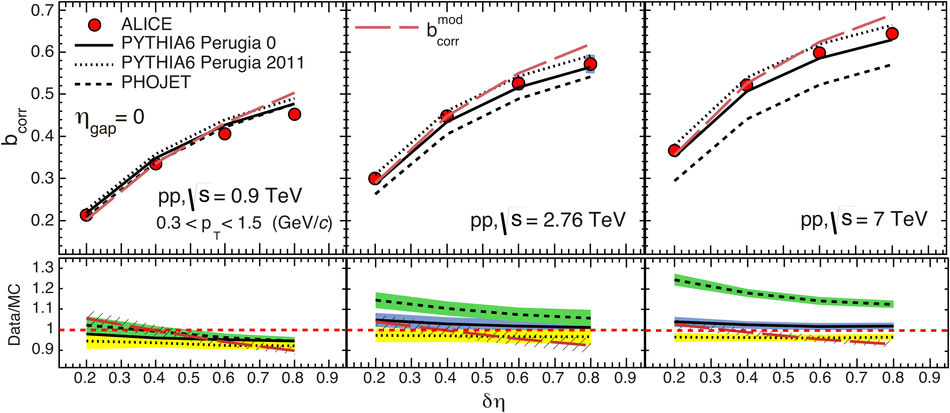 |