Mass difference distributions of $\Dstar$ candidates and charge conjugates in four selected $\pt$ intervals considered for the analysis. The topological and kinematical selections applied to obtain these distributions are described in the paper. The fit functions showed in the figure consist of a sum of Gaussian and a threshold function ($a \sqrt{\Delta M - M_{\pi} } \cdot e^{b(\Delta M - M_{\pi})} $, where $M_{\pi}$ is the pion mass and $a$ and $b$ are free parameters) to describe the signal and the background respectively. The values of the signal (S) and background counts (B) integrated in $\pm 3 \sigma$ region around the centroid of the Gaussian are reported. | 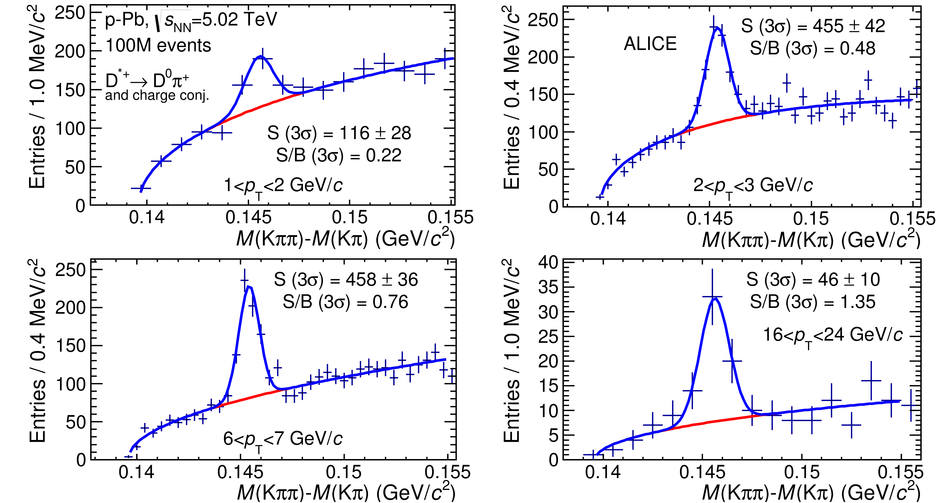 |