Centrality dependence of inclusive J/$ψ$ production in p-Pb collisions at $\sqrt{s_{\rm NN}}$ = 5.02 TeV

We present a measurement of inclusive J/$\psi$ production in p-Pb collisions at $\sqrt{s_{\rm NN}}$ = 5.02 TeV as a function of the centrality of the collision, as estimated from the energy deposited in the Zero Degree Calorimeters. The measurement is performed with the ALICE detector down to zero transverse momentum, $p_{\rm T}$, in the backward ($-4.46 <~ y_{\rm cms} <~ -2.96$) and forward ($2.03 <~ y_{\rm cms} <~ 3.53$) rapidity intervals in the dimuon decay channel and in the mid-rapidity region ($-1.37 <~ y_{\rm cms} <~ 0.43$) in the dielectron decay channel. The backward and forward rapidity intervals correspond to the Pb-going and p-going direction, respectively. The $p_{\rm T}$-differential J/$\psi$ production cross section at backward and forward rapidity is measured for several centrality classes, together with the corresponding average $p_{\rm T}$ and $p^2_{\rm T}$ values. The nuclear modification factor, $Q_{\rm pPb}$, is presented as a function of centrality for the three rapidity intervals, and, additionally, at backward and forward rapidity, as a function of $p_{\rm T}$ for several centrality classes. At mid- and forward rapidity, the J/$\psi$ yield is suppressed up to 40% compared to that in pp interactions scaled by the number of binary collisions. The degree of suppression increases towards central p-Pb collisions at forward rapidity, and with decreasing $p_{\rm T}$ of the J/$\psi$. At backward rapidity, the $Q_{\rm pPb}$ is compatible with unity within the total uncertainties, with an increasing trend from peripheral to central p-Pb collisions.


JHEP 11 (2015) 127
HEP Data
e-Print: arXiv:1506.08808 | PDF | inSPIRE
CERN-PH-EP-2015-158

Figure 1

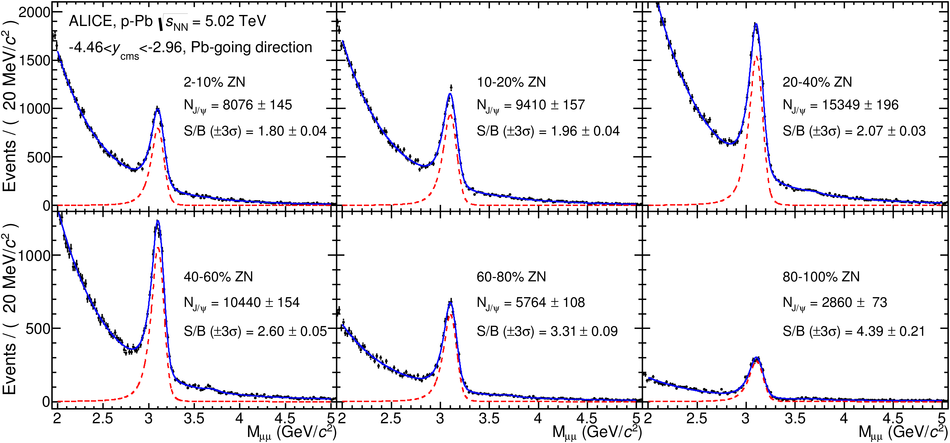
Unlike-sign dimuon invariant mass distributions for six centrality classes for $\pt < 15$ Gev/$c$ in the Pb-p configuration. The solid blue curves correspond to a fit based on a pseudo-Gaussian functionfor the $\jpsi$ and $\psi(\rm{2S})$ signals (see text) and an exponential multiplied by a second order polynomial function for the background. The red dashed lines represent the fitted signal function.

Figure 2

Invariant mass distributions of unlike-sign $e^+e^-$ pairs at mid-rapidity for the four considered\centrality classes. The background shape, represented by the dashed blue line, is derived from the event mixing technique. The two vertical dashed lines shownin each panel indicate the invariant mass interval used for the signal counting

Figure 3

Inclusive $\jpsi$ double-differential cross sections as a function of $\pt$ for various centrality classes at backward (left) and forward (right) rapidity. The systematic uncertainties correlated over centrality and $\pt$ are indicated as a global systematic uncertainty.

Figure 4

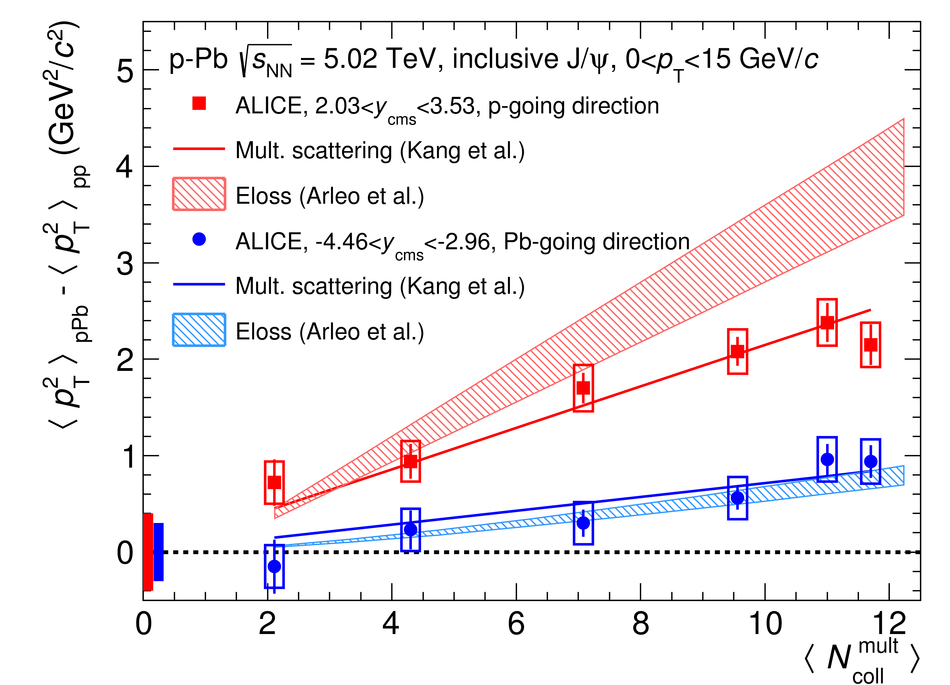
$\pt$ broadening, $\Delta\langle p^2_{\rm T}\rangle$, as a function of $\langle N^{\rm mult}_{\rm coll}\rangle$ at backward (blue circles) and forward (red squares) rapidity. The boxes centered at $\Delta\langle p^2_{\rm T}\rangle=0$ represent the total uncertainties of $\langle p^2_{\rm T}\rangle_{pp}$ interpolated to $\sqrt{s}=5.02$ TeV. The theoretical calculations are from Refs.[72-74].

Figure 5

Inclusive $\jpsi$ $Q_{\rm pPb}$ as a function of $\langle N^{\rm mult}_{\rm coll}\rangle$ at backward (left), mid (center) andforward (right) rapidity. The boxes centered at $Q_{\rm pPb}$ = 1 represent the relative uncertainties correlated over centrality. The theoretical calculations are from Refs.[16,17,74,75]

Figure 6

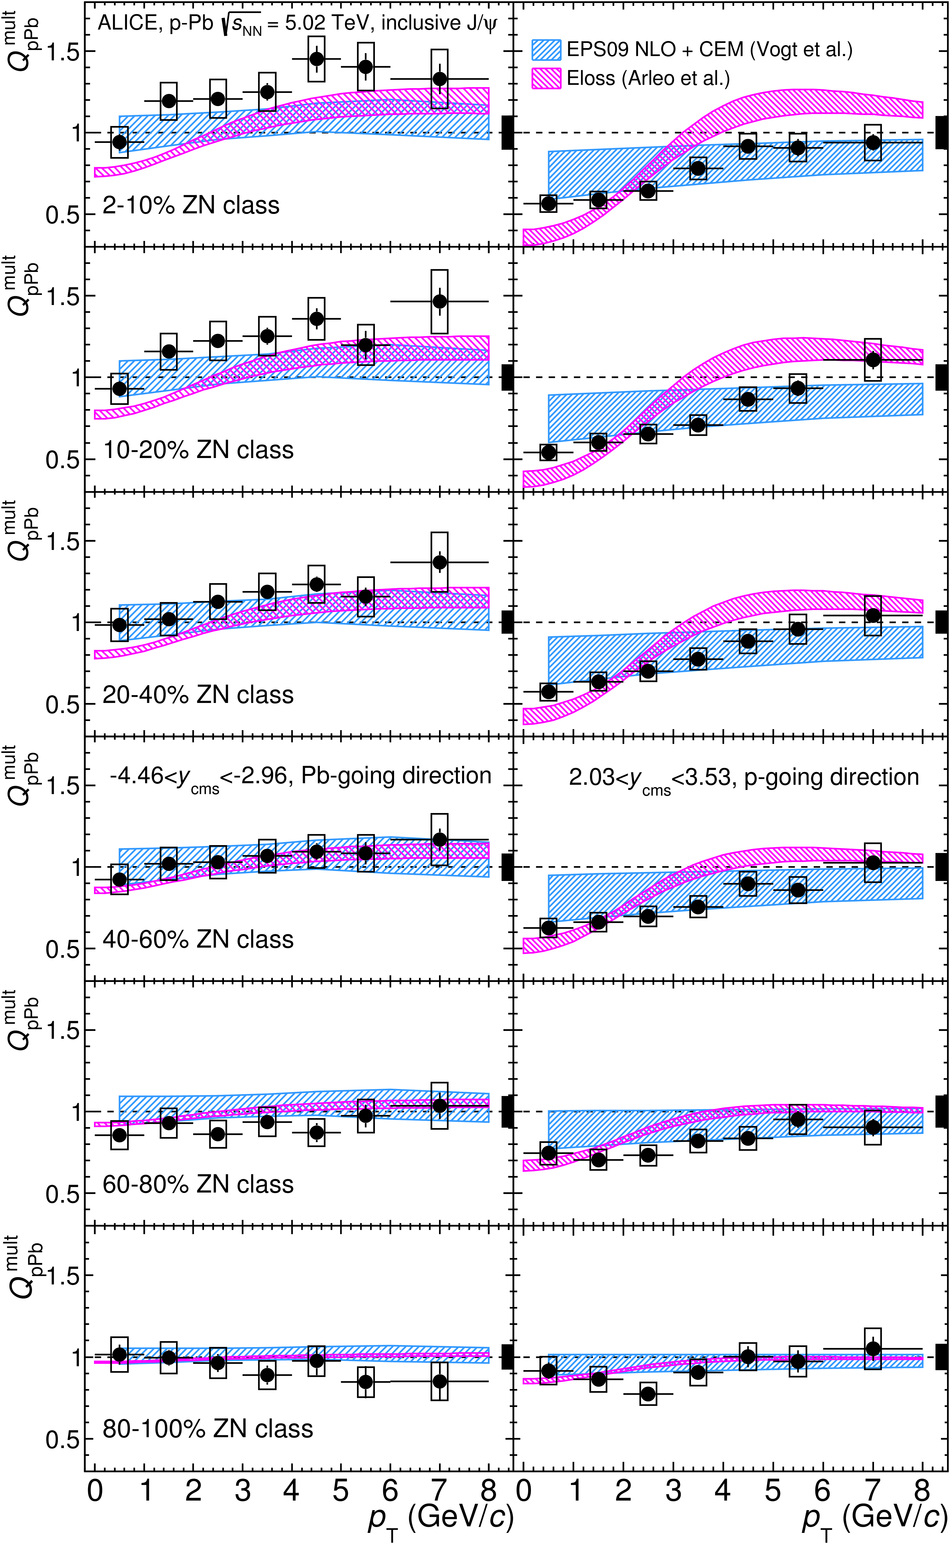
Inclusive $\jpsi$ $Q_{\rm pPb}$ as a function of $\pt$ for the 2-10%, 10-20%, 20-40%, 40-60%, 60-80% and 80-100% (from top to bottom) ZN centrality classes at backward (left) and forward (right) rapidity. The boxes centered at $Q_{\rm pPb}$ = 1 represent the relative uncertainties correlated over $\pt$. The theoretical calculations are from Refs. [16,74,75].