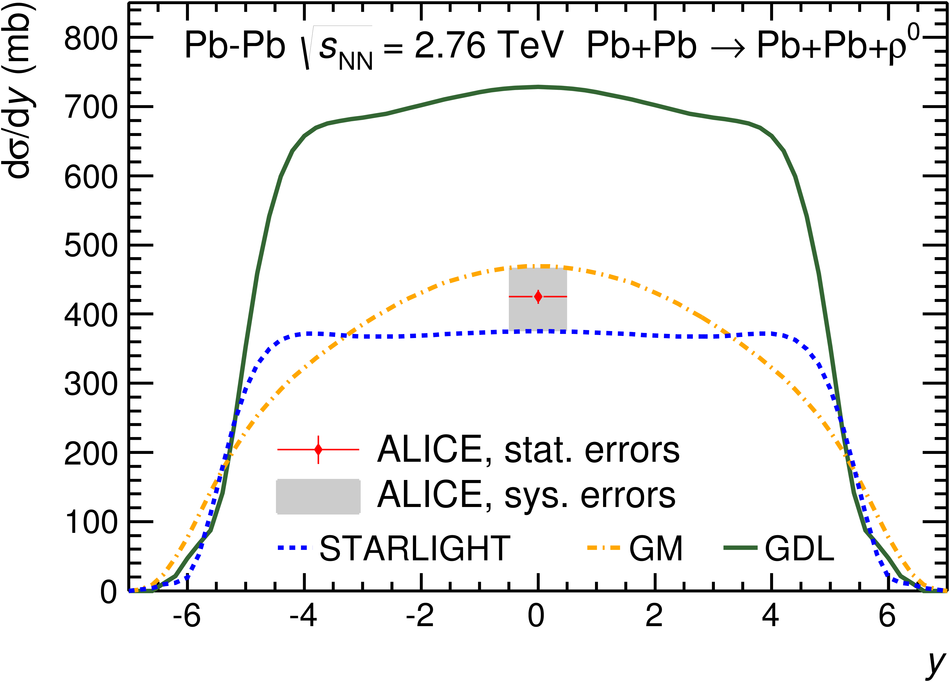
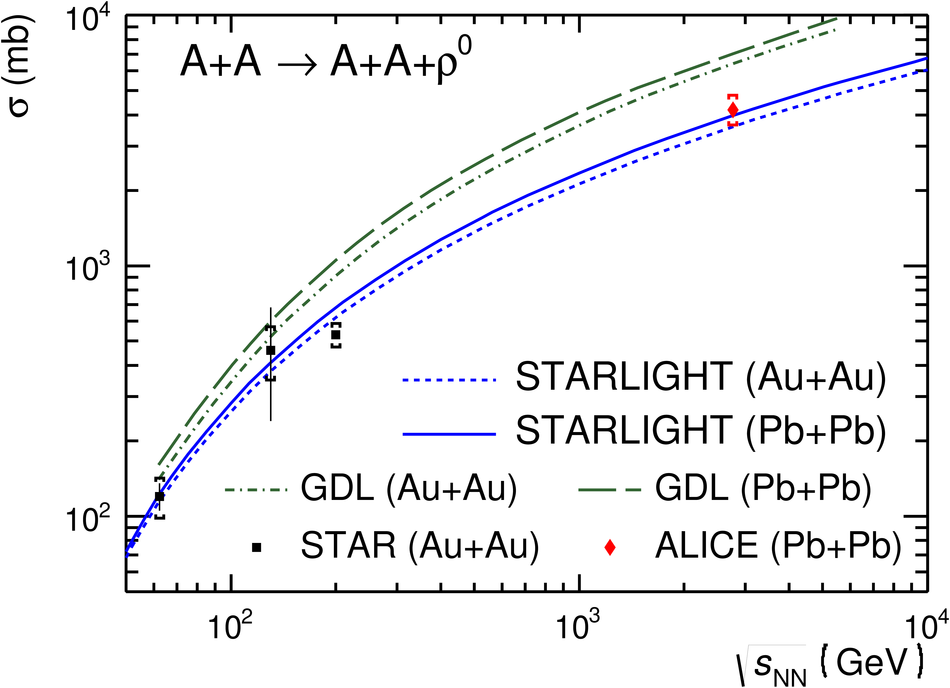
We report the first measurement at the LHC of coherent photoproduction of $\rho^0$ mesons in ultra-peripheral Pb-Pb collisions. The invariant mass and transverse momentum distributions for $\rho^0$ production are studied in the $\pi^+ \pi^-$ decay channel at mid-rapidity. The production cross section in the rapidity range $|y|<~0.5$ is found to be $\mathrm{d}\sigma/\mathrm{d}y = 425 \pm 10 \, (\mathrm{stat.})$ $^{+42}_{-50} \, (\mathrm{sys.})$ mb. Coherent $\rho^0$ production is studied with and without requirement of nuclear breakup, and the fractional yields for various breakup scenarios are presented. The results are compared with those from lower energies and with model predictions.
JHEP 09 (2015) 095
e-Print: arXiv:1503.09177 | PDF | inSPIRE
CERN-PH-EP-2015-082
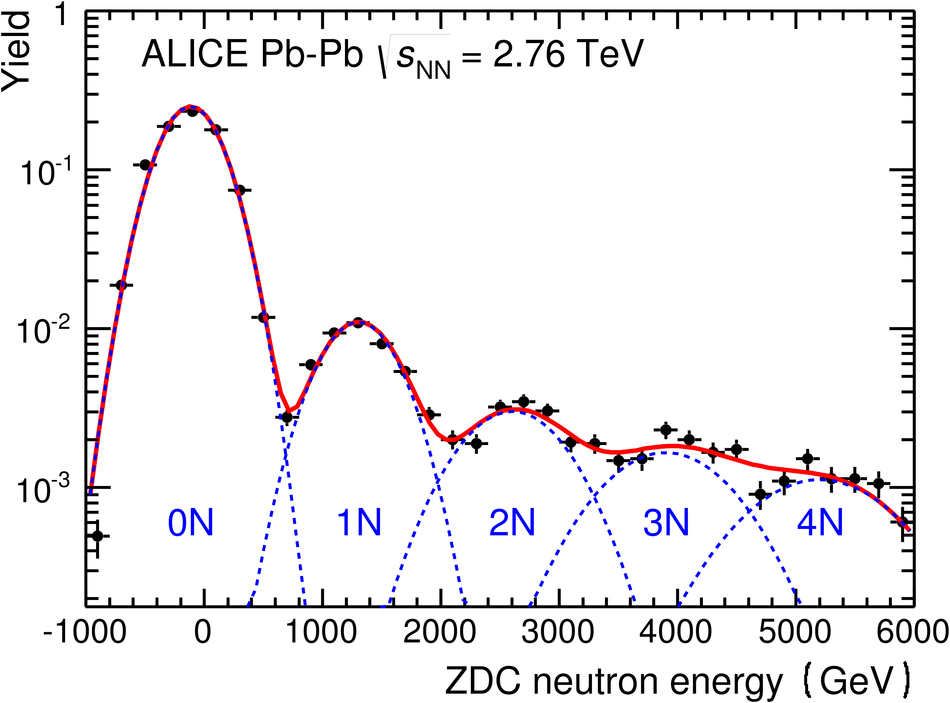
Figure 2
Identification of $\pi^{+/-}$ from the TPC d$E$/d$x$. The $x$- and $y$-axes show thedeviation of the measured energy loss from the Bethe-Bloch (BB) expectations for positive andnegative tracks, respectively. The scale is such that one unit corresponds to one standard deviation The circle, corresponding to $4 \sigma$, shows the selection used. The entries in the upperright corner are from $e^+e^-$ pairs produced in two-photon interactions. The plot is for eventssatisfying the requirements (i)-(iii) and (v)-(vi) described in the text | 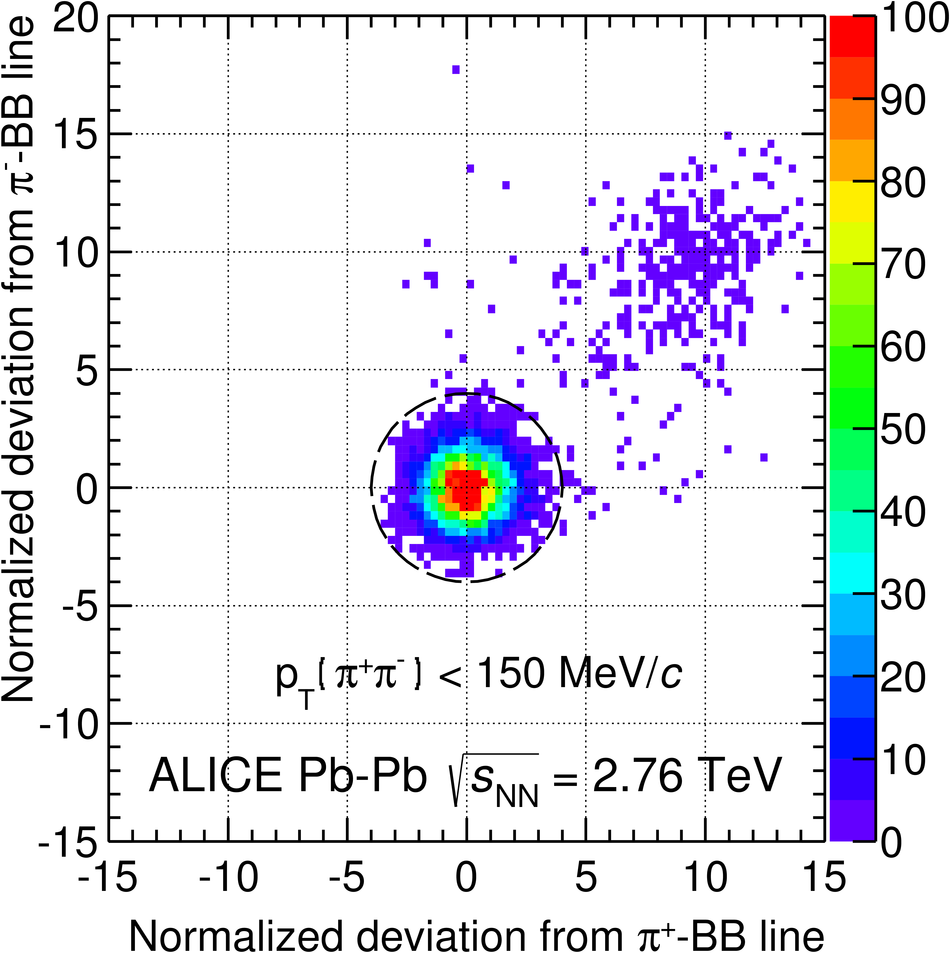 |
Figure 3
Transverse momentum distributions for $\pi^+ \pi^-$-pairs The dashed (red) and dash-dotted (blue) histograms show the normalized $p_{\rm T}$distribution from STARLIGHT passed through the detector response simulation for coherentand incoherent $\rho^0$ production, respectively. The solid (black) histogram isthe sum of the two. | 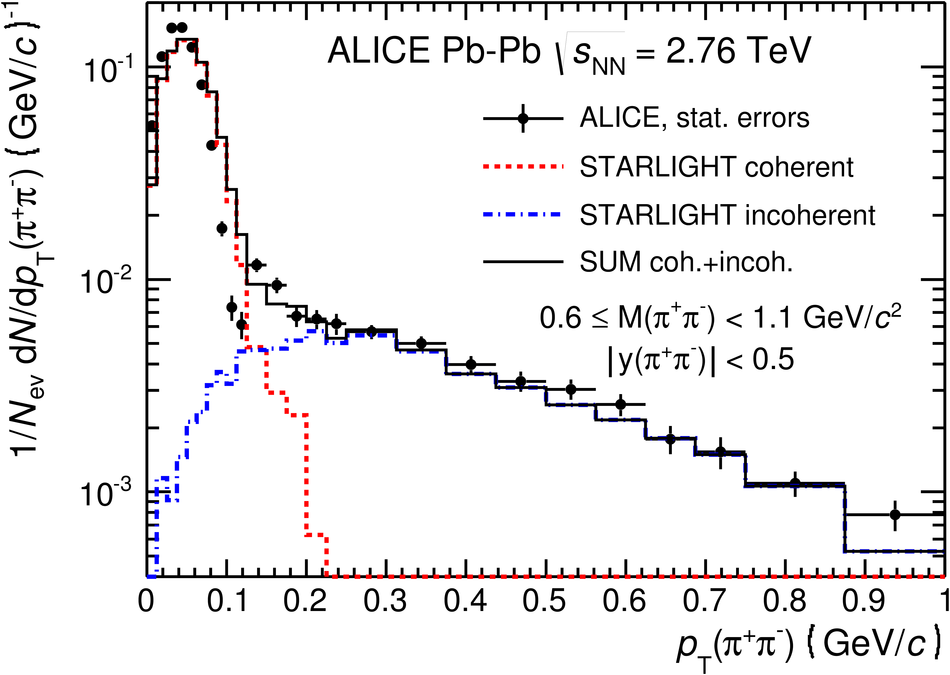 |
Figure 4
Invariant mass distribution for pions corrected for acceptance and efficiency The solid (blue) curve corresponds to a fit to the S"oding parameterization Eq.1,and the dashed (green) curve shows the resonant contribution only. The dot-dashed (red) curve showsthe fit to the Ross-Stodolsky parameterization Eq.3 The parameters of the fit are given in the text. |  |