The directed flow of charged particles at mid-rapidity is measured in Pb-Pb collisions at $\sqrt{s_\rm{NN}}=2.76$ TeV relative to the collision symmetry plane defined by the spectator nucleons. A negative slope of the rapidity-odd directed flow component with approximately 3 times smaller magnitude than found at the highest RHIC energy is observed. This suggests a smaller longitudinal tilt of the initial system and disfavors the strong fireball rotation predicted for the LHC energies. The rapidity-even directed flow component is measured for the first time with spectators and found to be independent of pseudorapidity with a sign change at transverse momenta $p_{\rm T}$ between $1.2$ and $1.7$ GeV/$c$. Combined with the observation of a vanishing rapidity-even $p_{\rm T}$ shift along the spectator deflection this is strong evidence for dipole-like initial density fluctuations in the overlap zone of the nuclei. Similar trends in the rapidity-even directed flow and the estimate from two-particle correlations at mid-rapidity, which is larger by about a factor of 40, indicate a weak correlation between fluctuating participant and spectator symmetry planes. These observations open new possibilities for investigation of the initial conditions in heavy-ion collisions with spectator nucleons.
Phys. Rev. Lett. 111 (2013) 232302
HEP Data
e-Print: arXiv:1306.4145 | PDF | inSPIRE
CERN-PH-EP-2013-100
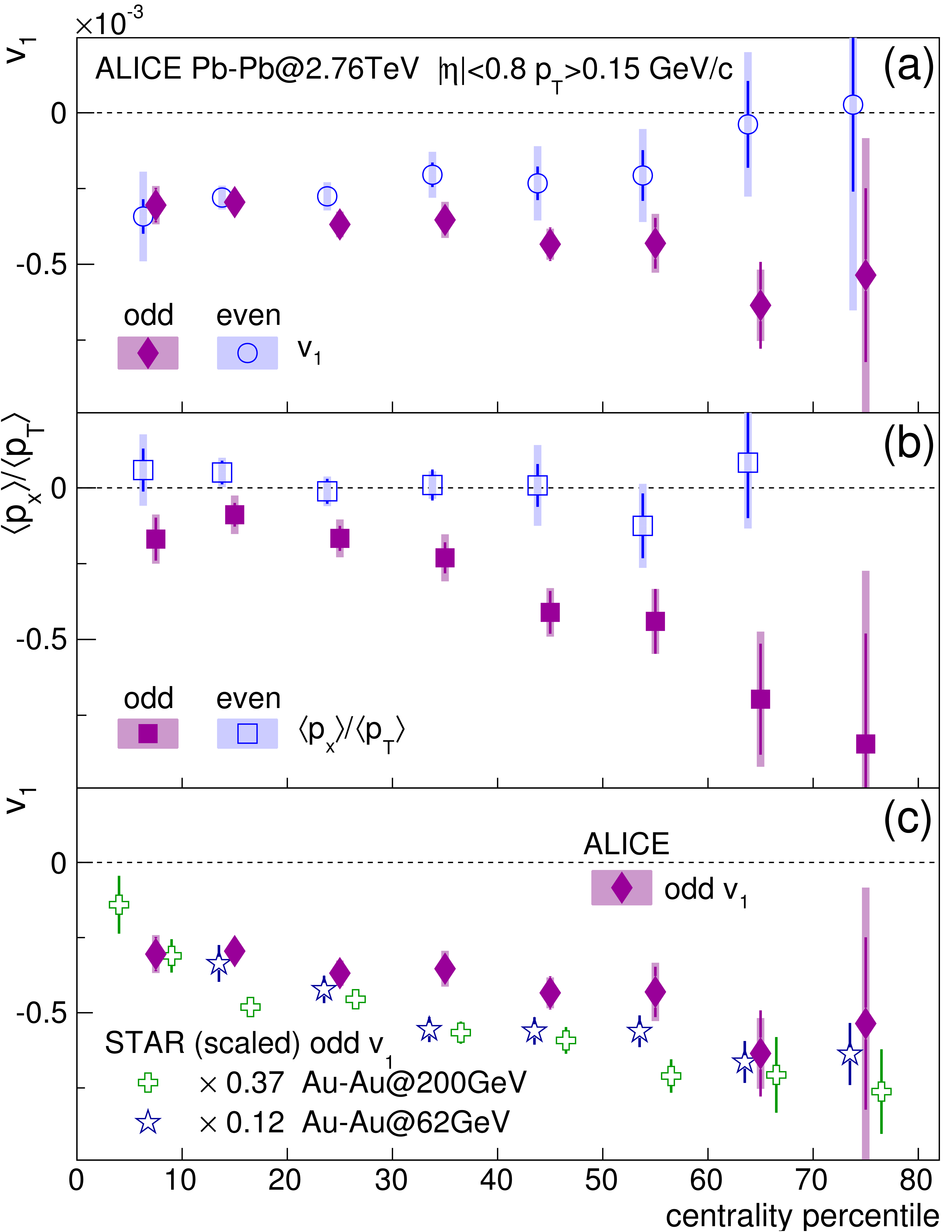
Figure 2
(a) $v_1$ and (b) $\langle p_{\rm x}\rangle/\langle\pt\rangle$ versus pseudorapidity in Pb-Pb collisions at $\sNN=2.76$ TeV. (c) $v_1^{\rm odd}$ compared to the STAR data for Au-Au collisions at $\sNN=200$ (62.4) GeV downscaled by a factor 0.37 (0.12). The statistical (systematic) uncertainties are indicated by the error bars (shaded bands). Lines (to guide the eye) represent fits with a linear (constant) function for $v_1^{\rm odd}$ ($v_1^{\rm even}$). | 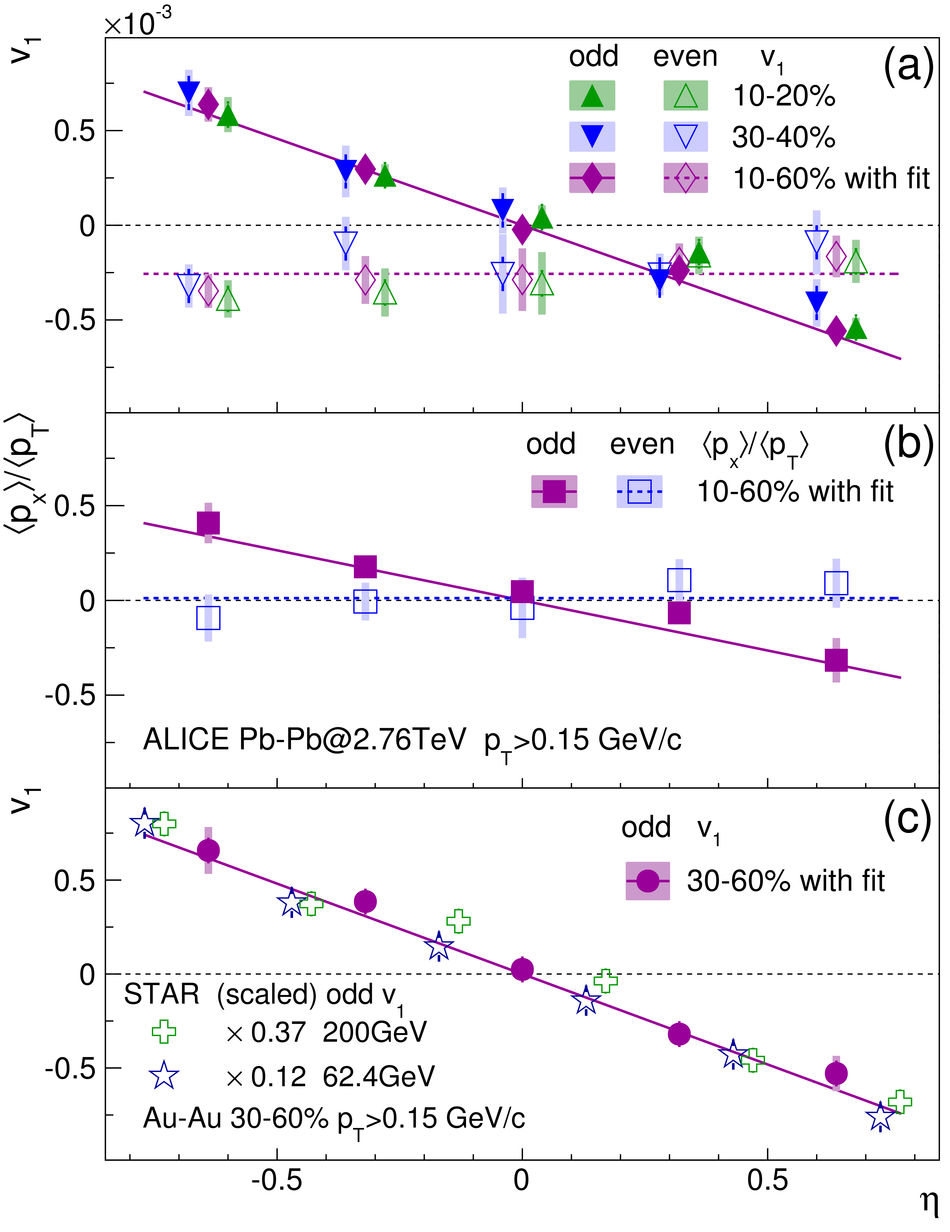 |